Most U.S. homeowners are sitting on plenty of equity. National home prices remain near record highs, and millions of borrowers locked in ultra-low rates during the pandemic. But a handful of Sunbelt markets tell a different story. There, home prices have fallen sharply from their peaks, and recent buyers are getting squeezed.
To put the current situation in perspective, the negative equity rate peaked at 23% during the Great Recession in September 2009. Since then, a combination of rising home prices, conservative lending standards, and pandemic‑era stimulus has dramatically improved homeowner balance sheets. Many borrowers who bought before 2020 have seen their home values double or more, while those with low‑rate mortgages are paying down principal faster than standard amortization schedules.
This financial cushion means that even if home prices dip moderately, the vast majority of homeowners remain above water. However, the recent downturn in Sunbelt markets highlights the vulnerability of buyers who entered at the peak of the pandemic boom.
Why National Negative Equity Is Low
As housing experts explain, "Being underwater means you owe more on your mortgage than your home is worth." It is also called negative equity. The low national rate is sustained by three key factors.
Get your free investing masterclass bonus when you join Market Briefs, our free daily newsletter
First, home prices across the country are still close to their historic peaks. Second, many homeowners locked in ultra-low mortgage rates during the pandemic, which means they have been paying down principal more aggressively; as of Q1 2026, 49.9% of outstanding mortgages still have rates below 4%. Third, tighter lending standards after the housing crisis mean that most borrowers have substantial down payments and solid credit, reducing the risk of negative equity.
These Sunbelt Markets Are Most at Risk
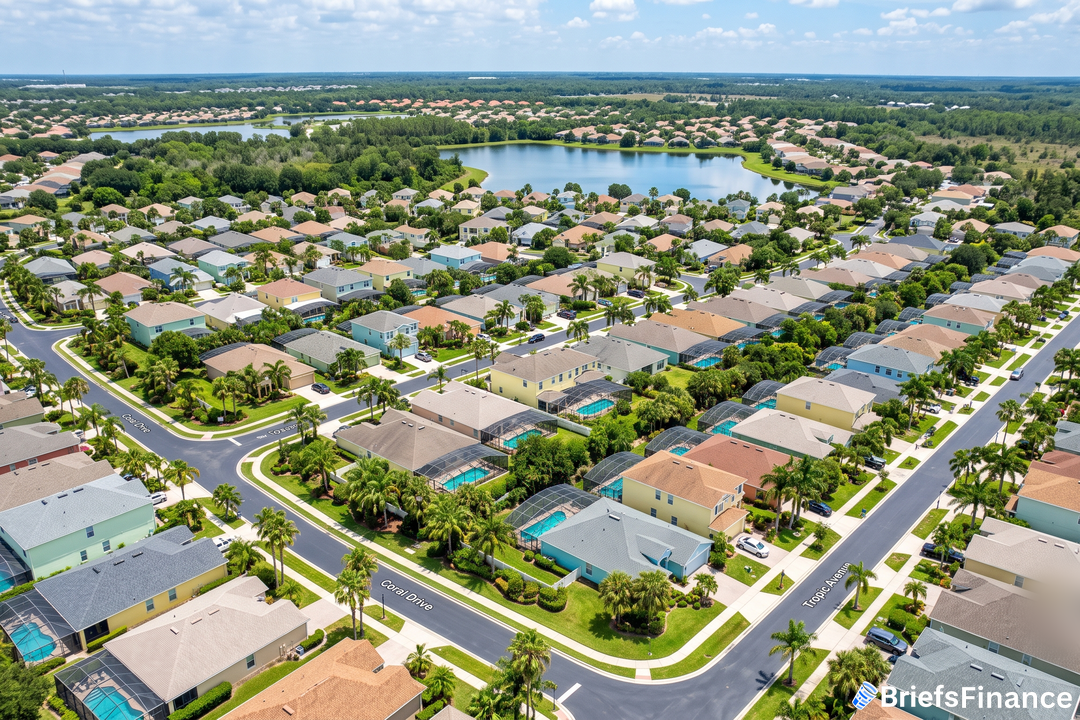
These cities saw huge home price jumps during the pandemic. Now they are giving back some of those gains. Home prices in Cape Coral‑Fort Myers have fallen 18.9% from their peak.
In Austin, the drop is even steeper at 27.3%. That hurts recent buyers most. Among Austin borrowers who bought in 2022, a striking 22.4% are underwater.
At the other end of the spectrum, Bridgeport, Connecticut, and San Jose, California, have just 0.1% of mortgages underwater. Boston, Los Angeles, and Hartford are at 0.2%. These markets never saw the same boom‑and‑bust pattern.
The pandemic-era housing boom was fueled by remote work, low interest rates, and demographic shifts toward warmer, more affordable regions. In Sunbelt cities like Cape Coral and Austin, prices surged as buyers competed for limited inventory. But once interest rates climbed and remote work patterns stabilized, demand cooled sharply, leaving recent purchasers with thin equity and heightened negative-equity risk.
ADVERTISEMENT
You can view the interactive version of the table covering all 100 metros analyzed by ICE Mortgage Technology here. While metros like Cape Coral (11.1%) and Austin (6.6%) have elevated underwater shares, these percentages remain far below the Great Financial Crisis peaks. In September 2009, Nevada saw 68% of borrowers underwater, Arizona 48%, and Florida 45%.
Currently, only recent borrowers from 2022-2025 are affected in these down markets. Furthermore, borrowers with thin equity - such as FHA and VA loans requiring as little as 3.5% down - are more likely to fall into negative equity. The key takeaway: if home prices continue to decline modestly in the Southwest, Southeast, and West, the underwater share among recent buyers will increase, but even then it won't approach the 2009-2010 levels.
Subscribe to Market Briefs, our free daily newsletter, and claim your bonus investing masterclass