Free NewsletterPro Login
S&P 500 6,287 +0.42%
DOW 44,521 -0.18%
NASDAQ 21,103 +0.71%

Warning: Undefined variable $funds in /var/www/briefs.co/htdocs/wp-content/plugins/oxygen/component-framework/components/classes/code-block.class.php(133) : eval()'d code on line 491

Warning: foreach() argument must be of type array|object, null given in /var/www/briefs.co/htdocs/wp-content/plugins/oxygen/component-framework/components/classes/code-block.class.php(133) : eval()'d code on line 491
/* the link was here */

Gold Rose 2,000% in the Last Price Crisis - Today's Debt Rules Out the Same Fix

Published Apr 19, 2026
[tts_player]
Share:
Summary:
  • In 1971, Nixon ended the dollar's link to gold, and prices rose from 1% to nearly 14.5% over the next ten years.
  • The trigger was a Middle East oil shock - the 1973 Arab oil ban after the Yom Kippur War.
  • Today's debt-to-GDP is above 120% versus 35% back then, so the Fed can't raise rates to 20% like Volcker did.

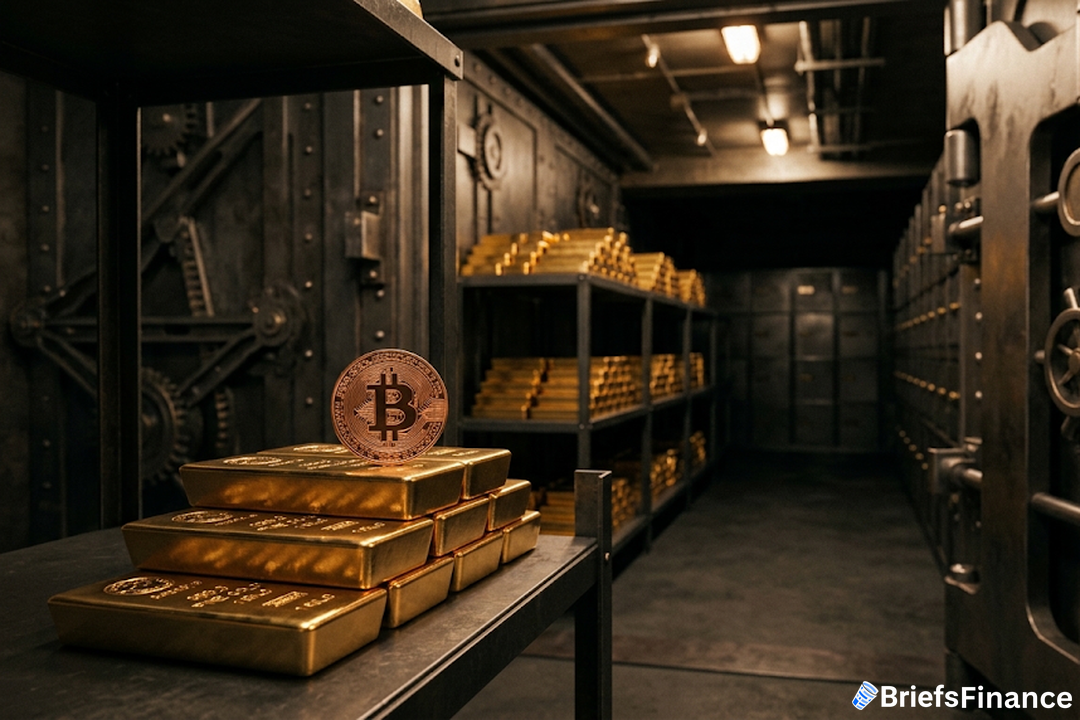
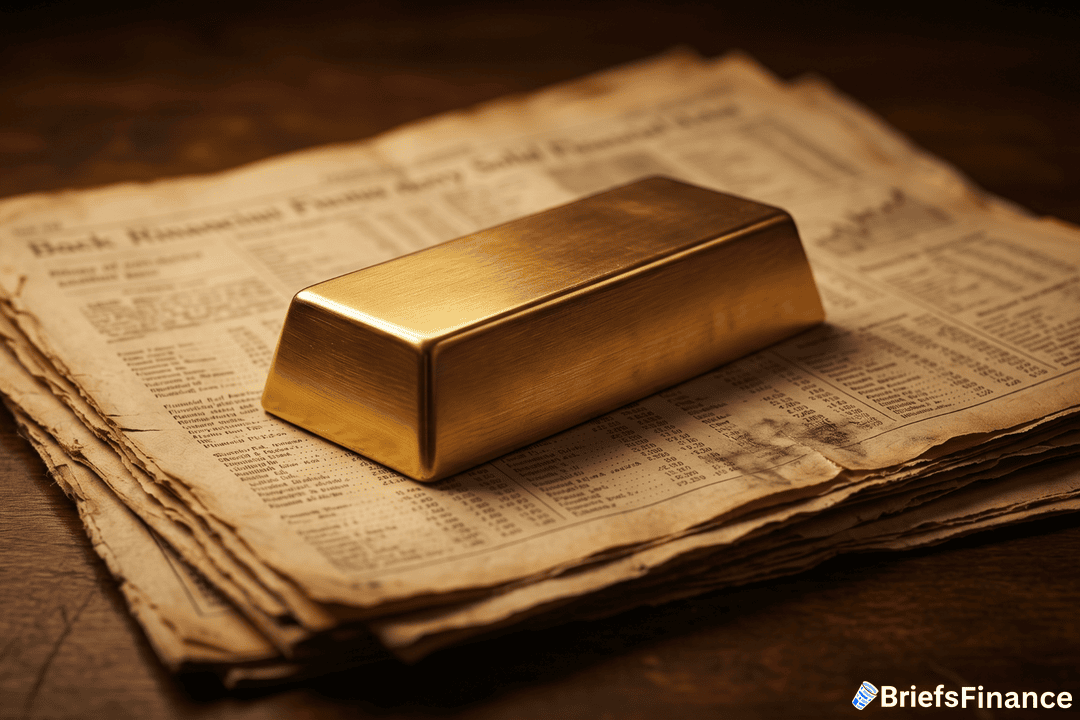
Gold sat at $35 an ounce in 1970 and topped $800 by 1980. That run came from two oil shocks and the end of the gold standard - a gain of more than 2,000%.

The same mix of conflict, rising oil, and a weaker dollar is back in 2026. But this time the debt blocks the tool that stopped it before.

How the 1970s Started

On August 15, 1971, Nixon cut the dollar's last link to gold. After that, no country could swap its dollars for gold at the Treasury.

With that limit gone, the government could print as much as it wanted. Prices kept building even as the White House froze wages to hide the damage.

Then came the oil shock. In October 1973, Arab oil states cut off shipments after the Yom Kippur War. That ban sent crude prices up four times over.

A second shock hit in 1979 from Iran's revolt, tripling oil prices again. The cost of living had sat at 1% in 1964.

By 1974, it topped 12% after those two jolts. The back-to-back shocks changed what people paid for nearly everything.

By 1980 it peaked near 14.5% as the dollar lost a third of its value. The economy stalled while prices kept rising - a combo called "stagflation."

That stretch lasted about 15 years. Gold went from $35 to above $800 over the same run.

Cash and bonds fell far behind during that time. Savers lost buying power year after year as prices outran their returns.

Real estate was one of the few assets that kept pace. Homes and land held their value as rents rose in step with costs.

Why 2026 Looks Like the 1970s With Higher Debt

Today's setup looks like the 1970s in many ways. There's a war in the Middle East, oil has spiked, and gas is above $4.

Economists are using the word "stagflation" again as a result. But the big gap between then and now is the debt.

The key gap: In the 1970s, debt sat at about 35% of GDP. That low level gave Volcker room to raise rates to 20% in 1981.

His move crushed prices but also caused 10% jobless rates and a deep slump. Today debt is above 120% of GDP, which changes the math.

The same rate hike on $39 trillion would cost hundreds of billions more a year. The budget can't take that hit, which takes the main fix off the table.

What to Watch

Hard assets won in the 1970s, with gold up more than 2,000%. Real estate held its value while cash and bonds fell behind.

If the 2026 cycle follows the same path - but without the option to hike rates - the move out of cash could go further. The playbook is 50 years old.

But with debt above 120% of GDP, the exit route that worked last time is blocked. That gap is what sets this cycle apart.

The question isn't whether the pattern matches. It's whether the same tools are still on the table - and the debt says they're not.

Disclosure

Recent News

1 2 3 55

Get Market Briefs delivered to your inbox every morning for free!

No fluff. No noise. No politics. Just finance news you can read in 5 minutes.

Blogs

June 29, 2026
Portfolio Diversification: Why Putting All Your Eggs in One Basket Destroys Wealth
  • Real diversification means spreading investments across all 11 economic sectors plus bonds, alternatives, and cash so no single bet can sink the portfolio.
  • Different sectors perform at different times, so a diversified portfolio captures upswings while smoothing the brutal drawdowns that wipe out concentrated bets.
  • Total market index funds offer the simplest path to diversification, and annual rebalancing is what keeps the structure working over time.
Read More
June 29, 2026
Non Taxable Income: What It Is and Why It Matters
  • Non taxable income is money you receive that you don't owe income tax on.
  • The tax code treats workers, investors, and business owners very differently, and investors often come out ahead.
  • Learning how income is taxed is a quiet superpower for keeping more of what you earn.
Read More
June 29, 2026
Semiconductor Stocks: A Simple Guide for Investors
  • Semiconductor stocks are companies that design and make computer chips, the brains inside nearly every modern device.
  • The AI boom has turned chips into one of the market's most important and most watched groups.
  • They offer big growth potential, but come with high valuations and a notoriously cyclical history.
Read More
June 25, 2026
How Stocks Work: A Simple Guide for Beginners
  • A stock is a slice of ownership in a company - buy one, and you own a piece of the business.
  • You make money two ways: the share price rising over time, and dividends paid to shareholders.
  • The simplest path for most beginners is buying into the whole market through a low-cost index fund.
Read More
June 25, 2026
Stop Loss vs Stop Limit: What's the Difference?
  • A stop loss order sells your stock once it hits a trigger price, prioritizing getting you out.
  • A stop limit order only sells within a price range you set, prioritizing price over a guaranteed exit.
  • The trade-off: a stop loss almost always executes; a stop limit might not if the price moves too fast.
Read More
June 25, 2026
Energy Stocks: A Simple Guide for Investors
  • Energy stocks are companies that produce and supply the power the world runs on, from oil and gas to newer sources.
  • They make up one of the 11 sectors of the market and tend to move with energy prices and big-picture shifts.
  • Like any sector, the key is diversification and understanding the forces driving demand.
Read More
June 18, 2026
What Is a Stop Loss Order? A Simple Guide
  • A stop loss order automatically sells a stock once it falls to a price you set.
  • It's a tool to cap losses or lock in gains without watching the market all day.
  • It works best for active strategies, and can backfire if used carelessly on long-term holdings.
Read More
June 18, 2026
Best S&P 500 Index Fund: How to Choose One
  • The best S&P 500 index fund for most investors is simply the cheapest, most established one that tracks the index well.
  • Funds like VOO, IVV, and SPY all hold the same 500 companies, so the biggest difference is the fee.
  • Pick one, automate your buys, and let time do the heavy lifting.
Read More
June 17, 2026
What Are Penny Stocks? Risks and Rewards Explained
  • Penny stocks are very low-priced shares of very small companies, often trading for just a few dollars or less.
  • They promise huge gains but carry huge risks: low liquidity, high failure rates, and wild price swings.
  • Most investors are better served by quality companies and funds than by chasing cheap shares.
Read More
June 17, 2026
Best Stocks for Beginners With Little Money
  • The best stocks for beginners with little money usually aren't individual stocks at all - they're low-cost index funds.
  • You can start with $100 or less and use small, regular investments to build wealth over time.
  • Focus on diversification and consistency, not on picking the next big winner.
Read More
1 2 3 24
Share via
Copy link