Free NewsletterPro Login
Free Live Investors Workshop
Seats limited
Tue, Sep 29.
The dollar is losing value.
Here’s how investors can still profit.
Hosted By
Jaspreet Singh
Founder, Briefs Finance
X

Warning: Undefined variable $stocks in /var/www/briefs.co/htdocs/wp-content/plugins/oxygen/component-framework/components/classes/code-block.class.php(133) : eval()'d code on line 448

Warning: foreach() argument must be of type array|object, null given in /var/www/briefs.co/htdocs/wp-content/plugins/oxygen/component-framework/components/classes/code-block.class.php(133) : eval()'d code on line 448

Warning: Undefined variable $funds in /var/www/briefs.co/htdocs/wp-content/plugins/oxygen/component-framework/components/classes/code-block.class.php(133) : eval()'d code on line 472

Warning: foreach() argument must be of type array|object, null given in /var/www/briefs.co/htdocs/wp-content/plugins/oxygen/component-framework/components/classes/code-block.class.php(133) : eval()'d code on line 472
/* the link was here */

Gold Rose 2,000% in the Last Price Crisis - Today's Debt Rules Out the Same Fix

Published Apr 19, 2026
Share:
Summary:
  • In 1971, Nixon ended the dollar's link to gold, and prices rose from 1% to nearly 14.5% over the next ten years.
  • The trigger was a Middle East oil shock - the 1973 Arab oil ban after the Yom Kippur War.
  • Today's debt-to-GDP is above 120% versus 35% back then, so the Fed can't raise rates to 20% like Volcker did.

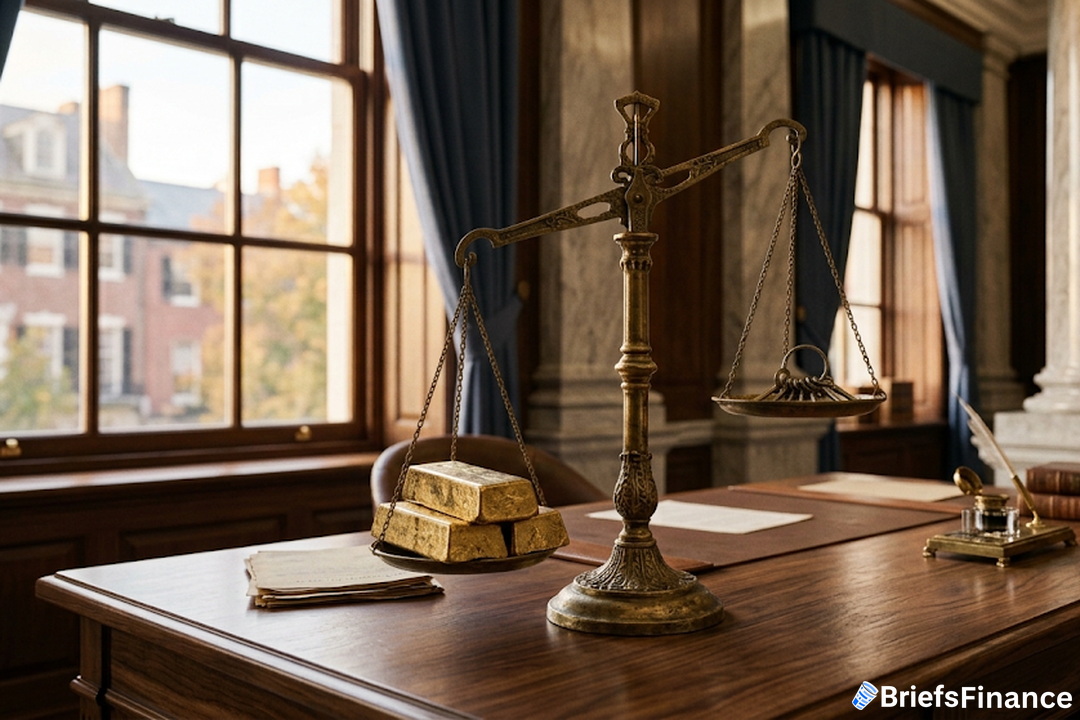
Gold sat at $35 an ounce in 1970 and topped $800 by 1980. That run came from two oil shocks and the end of the gold standard - a gain of more than 2,000%.

The same mix of conflict, rising oil, and a weaker dollar is back in 2026. But this time the debt blocks the tool that stopped it before.

How the 1970s Started

On August 15, 1971, Nixon cut the dollar's last link to gold. After that, no country could swap its dollars for gold at the Treasury.

With that limit gone, the government could print as much as it wanted. Prices kept building even as the White House froze wages to hide the damage.

Then came the oil shock. In October 1973, Arab oil states cut off shipments after the Yom Kippur War. That ban sent crude prices up four times over.

A second shock hit in 1979 from Iran's revolt, tripling oil prices again. The cost of living had sat at 1% in 1964.

By 1974, it topped 12% after those two jolts. The back-to-back shocks changed what people paid for nearly everything.

By 1980 it peaked near 14.5% as the dollar lost a third of its value. The economy stalled while prices kept rising - a combo called "stagflation."

That stretch lasted about 15 years. Gold went from $35 to above $800 over the same run.

Cash and bonds fell far behind during that time. Savers lost buying power year after year as prices outran their returns.

Real estate was one of the few assets that kept pace. Homes and land held their value as rents rose in step with costs.

Why 2026 Looks Like the 1970s With Higher Debt

Today's setup looks like the 1970s in many ways. There's a war in the Middle East, oil has spiked, and gas is above $4.

Economists are using the word "stagflation" again as a result. But the big gap between then and now is the debt.

The key gap: In the 1970s, debt sat at about 35% of GDP. That low level gave Volcker room to raise rates to 20% in 1981.

His move crushed prices but also caused 10% jobless rates and a deep slump. Today debt is above 120% of GDP, which changes the math.

The same rate hike on $39 trillion would cost hundreds of billions more a year. The budget can't take that hit, which takes the main fix off the table.

What to Watch

Hard assets won in the 1970s, with gold up more than 2,000%. Real estate held its value while cash and bonds fell behind.

If the 2026 cycle follows the same path - but without the option to hike rates - the move out of cash could go further. The playbook is 50 years old.

But with debt above 120% of GDP, the exit route that worked last time is blocked. That gap is what sets this cycle apart.

The question isn't whether the pattern matches. It's whether the same tools are still on the table - and the debt says they're not.

Disclosure

Recent News

1 2 3 … 88

Get Market Briefs delivered to your inbox every morning for free!

No fluff. No noise. No politics. Just finance news you can read in 5 minutes.

Blogs

September 29, 2026
Why Is Gold Going Down? A 5.2% Treasury Yield Just Took Its Job
  • President Trump rejected Iran's deal to reopen the Strait of Hormuz, oil prices jumped back up, and gold fell instead of rising.
  • Treasury yields hit their highest level in more than 20 years, so investors sold gold and bought Treasuries that pay interest.
  • Higher Treasury yields make the national debt, mortgages, car loans, and credit cards more expensive, with the Fed's next rate decision due October 28.
Read More
September 28, 2026
The Strategic Bitcoin Reserve: Why the Government Wants Bitcoin to Explode
  • The US government holds about 328,000 Bitcoin, worth roughly $25 billion, and since a 2025 executive order it keeps seized coins instead of selling them.
  • Washington wants a bigger pile of assets so its $40 trillion national debt looks smaller next to them, which lets it keep borrowing and spending.
  • Bitcoin's wild price swings, and a government holding a coin built to escape governments, are the two risks investors need to watch.
Read More
September 25, 2026
BRIEFS EXCLUSIVE: 43% Of Respondents Say Bills Outran Their Income Over Past Two Years
  • 43% of the 494 Market Briefs readers surveyed said their bills grew faster than their income over the past two years, even though 79% could cover a surprise $5,000 expense tomorrow.
  • Half of readers own gold or crypto, the two classic bets against a weaker dollar, and only 13% bought nothing at all in the last 12 months.
  • The median reader says it takes $150,000 a year to feel financially secure, about $62,000 above the U.S. median household income.
Read More
September 25, 2026
The Economy Is Booming. So Why Did Stocks and Bonds Fall Together?
  • S&P Global says the US economy is growing at its fastest rate since 2021, with corporate profits up 28.9% in a year, almost four times the historical average.
  • Stocks and bonds fell at the same time, which is not how the two markets normally behave, because Treasury yields above 5% now compete with stocks for investors' money.
  • Jaspreet Singh lays out three ways to invest through a shift like this: always be buying, buy the crash, or follow the money before it hits the headlines.
Read More
September 24, 2026
The 2026 Economic Reset Is Starting: Are We in a Recession, or Is the Pain Still Ahead?
  • The Federal Reserve has flipped from stimulating the economy to fighting inflation with higher interest rates, while the White House still wants growth at almost any cost.
  • The national debt tops $40 trillion, has outgrown the entire U.S. economy, and its interest payments are now the government's fastest-growing expense.
  • Higher rates bring pain for private equity, private credit, and speculative assets, but they open opportunities for investors holding cash, treasuries, and value assets.
Read More
September 23, 2026
Are We in a Recession? Without AI, America Might Already Be in One - and Washington Knows It
  • The White House attributes about three quarters of U.S. economic growth to AI, and many believe the economy would already be in a recession without it.
  • Washington has three reasons it cannot let the AI boom slow down: staying the world's superpower, outgrowing $40 trillion in national debt, and protecting a government stock portfolio worth billions.
  • Every market goes through booms and busts, and investors who understand the cycle get to buy the downturn instead of panic-selling with the crowd.
Read More
September 22, 2026
Will Interest Rates Go Down in 2026? Where the Money Moves Either Way
  • The Fed is leaning toward higher rates to fight 4% inflation, while the White House and a cracking job market push the other way.
  • If rates rise, money has tended to move toward short-term Treasuries, floating-rate loans, energy, banks and dividend payers.
  • If rates fall, it has tended to move toward gold, silver and Bitcoin, real estate, small caps, the S&P 500 and speculative bets.
Read More
September 21, 2026
How the Federal Reserve Makes Money - and Why It Just Posted Its Biggest Loss Ever
  • For 109 years the Federal Reserve created money, lent it to the U.S. government and handed the interest it collected back to Washington - almost $1 trillion in the decade starting in 2011.
  • Pandemic-era lending locked the Fed into earning about 2% on trillions of dollars while it now pays banks around 4%, producing a record loss of hundreds of billions in 2026.
  • The Fed covers its losses by creating money and the government covers its lost revenue by borrowing, and both feed the inflation that eats at the dollars in your account.
Read More
September 18, 2026
Kevin Warsh Just Defied Trump: What the Fed Rate Hike Means for Your Money
  • The Fed raised rates for the first time since 2023 in a unanimous vote led by Kevin Warsh, the chairman President Trump appointed to cut them.
  • Higher rates make the $40 trillion national debt, business loan resets and mortgages more expensive, but they strengthen the dollar and pay investors holding cash.
  • The war with Iran is pushing up oil, grocery and chip prices, another hike is likely in 2026, and recession talk is about to get louder.
Read More
September 17, 2026
Why America Bailed Out the Yen: The Japan Carry Trade, the Dollar and Your Mortgage Rate
  • In July 2026 the US sent money to steady the yen because Japan is the largest foreign owner of US debt, and Washington needs Japan to keep lending.
  • For decades the Japan carry trade let Wall Street borrow yen at essentially 0% and pour it into US stocks, real estate and Treasuries, and rising Japanese rates are shutting that off.
  • A weaker yen means fewer buyers for the dollar and for US debt, which pushes Treasury rates up and drags mortgage, car loan and credit card rates up with them.
Read More
1 2 3 … 27
Share via
Copy link