What the report found on market activity and demand
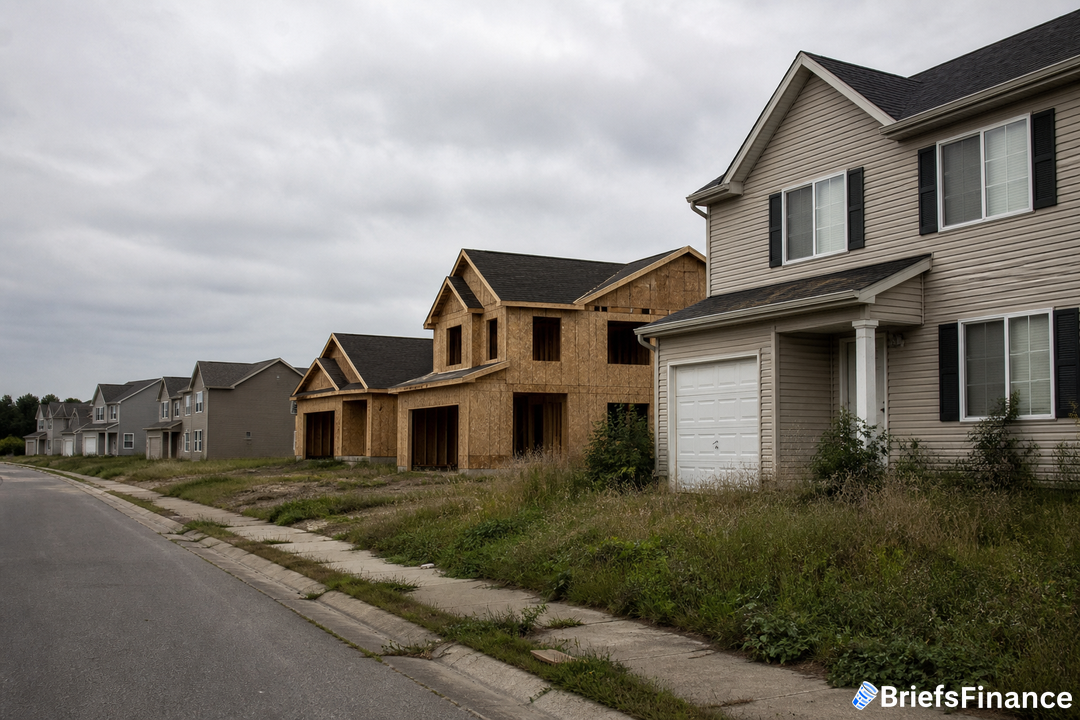
Housing activity stayed sluggish into early 2026. After plunging to a three-decade low in 2023, existing-home transactions have yet to recover. New home sales were largely flat.
Total construction starts edged down 1 percent in the last year, largely because single-family starts fell 7 percent. Renters were more likely to stay put, new move ins declined, and annual household growth slowed for a third straight year in 2025. Growth in homeowner households was cut in half, pushing the homeownership rate down for a second consecutive year.
Apartment demand also cooled, with the year over year increase in renters in Q1 2026 less than half of the prior year's gain. Underlying economic drivers weakened: payrolls grew by 1.5 million in 2024 but added only 116,000 jobs in 2025. Consumer confidence slid by more than 20 percentage points during 2025 and dropped further after conflict in Iran began, hitting an all time low in April 2026.
The report notes those confidence readings fell below the lows of the Great Recession and the pandemic. Put together, softer job growth and shaken confidence are weighing on moves and big ticket housing decisions.
Prices, payments, and who can afford what
Prices remain elevated. Medians for both new and existing homes top $400,000. Existing home prices have climbed 54 percent nationwide since 2020 and now sit at nearly five times median incomes, compared with a typical ratio of about three in the 1990s.
With mortgage rates staying above 6 percent, the median-priced home carried a $3,100 monthly payment in Q4 2025, compared with $1,700 in early 2020. Affording that Q4 2025 payment takes a household income north of $120,000, versus $66,000 in 2020.
Those payment estimates are based on a 3.5% down payment with a 30 year fixed rate loan, including 0.55% for mortgage insurance, 0.35% for property insurance, and a 1.15% property tax rate.
Soft demand and high prices at the same time is an unusual combination, and it does not hold forever. Market Briefs reads the housing data free every weekday.
Supply, vacancies, and which units are rising or falling
A run of multifamily building since 2022 and steady single family construction have eased the tightest vacancies. The rental vacancy rate rose from a 5.9 percent trough in 2022 to 7.3 percent in Q1 2026. The for sale vacancy rate picked up from a 0.81 percent all time low in 2023 to 1.13 percent. Both are now nearer to 1990s norms of 7.7 percent for rentals and 1.6 percent for homes for sale.
The shifts vary by place. In Austin, where building has been heavy, the apartment vacancy rate is up 5 percentage points since 2021 and for sale listings nearly tripled. In Chicago, where construction was more subdued, the apartment vacancy rate is up only 0.5 percentage points and for sale listings are down 20 percent over the same period.
By price point, the gains have skewed expensive. Over the last decade, additions to the rental stock have been almost entirely higher rent units. The number of rentals under $1,000 a month fell by 7 million as those homes disappeared or moved up to higher rents, a threshold the report notes is roughly affordable to a $40,000 income.
For would be buyers, NAR/Realtor.com data show listings within reach for households making $75,000 or less in March 2026 were 60 percent lower than in March 2019. And at the very bottom, the National Low Income Housing Coalition counts 11 million extremely low income renters competing for just 3.8 million affordable and available units, a gap of 7.2 million.
Who is most squeezed and what it means for your money
Affordability is worst for those with the least. Renter cost burdens hit a new record in 2024. Among renters making under $30,000, 83 percent spent over 30 percent of income on housing and 66 percent spent more than half.
Low income homeowners also face record rates of burden, alongside rising insurance premiums, property taxes, energy and utility bills, and broader inflation. After paying rent, 13 million renter households under $30,000 in income had a median of just $210 left each month for everything else, down from $410 in 2019 after inflation, while prices for non housing necessities have climbed.
Bottom line for your wallet: prices are still lofty, borrowing stays costly, vacancies are easing but uneven, and the affordable end of the market is vanishing fastest. That combination can keep pressure on budgets even if sales stay slow, with sharp differences by city and price tier shaping what you will actually find on the ground.
Knowing which way affordability is actually breaking changes how you plan a purchase. Join Market Briefs free and track it month to month.