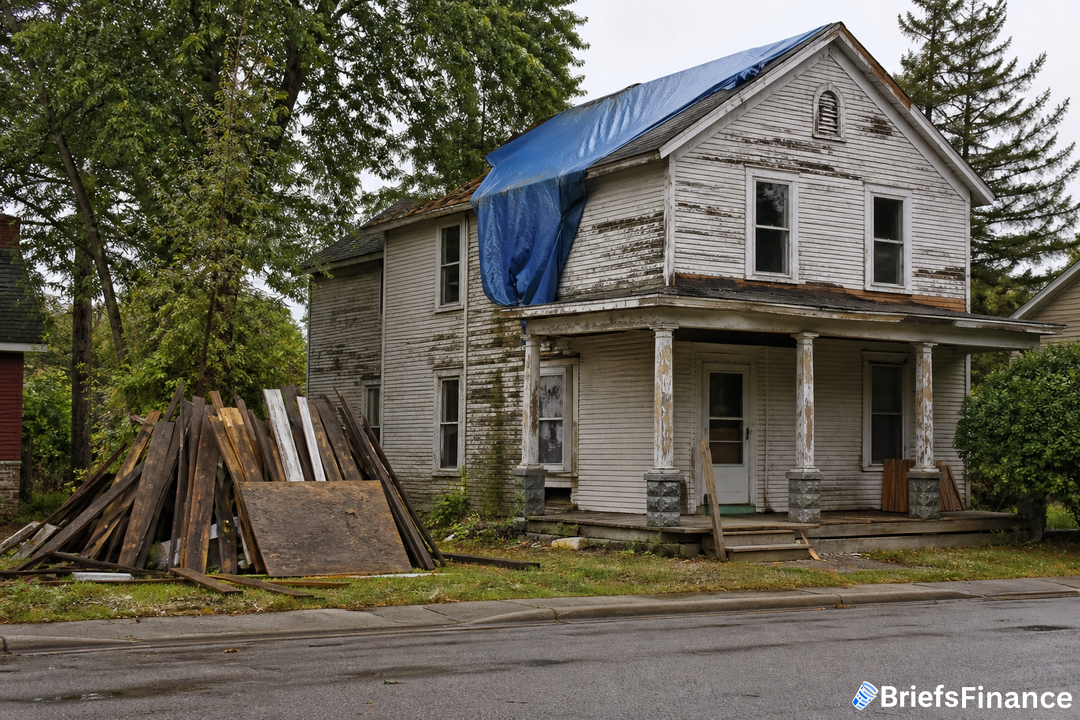
Why the housing stock is getting older
As of 2023, the median age of a U.S. home reached 44 years; in 2013 it was 39, and in 1993 it was 28. A building slump during the Great Recession added far fewer new units than prior decades, so fewer young homes rotated into the stock. At the same time, tougher codes and better materials and construction techniques have kept existing houses serviceable for longer, lifting the overall age of the inventory. By 2023, roughly one-quarter of homeowners - 22 million households - occupied dwellings built before 1960.
How spending shifts as homes age
Once houses get past two decades, spending steps up and stays elevated as major systems time out. In 2023, replacements like roofs, siding, windows, insulation, and HVAC took a 39 percent share of spending for homes built before 1960, well above the 24 percent share for those built in 2010 or later. Routine upkeep made up 22 percent of remodeling and repair outlays on the oldest homes, compared with 16 percent on the newest ones.
Newer properties leaned harder into outdoor projects such as fencing, landscaping, and sheds or pools, which captured about one third of spending, while pre-1960 homes devoted just 10 percent to those outside improvements. Additions and exterior attachments like porches were also a bigger slice for newer homes at 15 percent, versus 8 percent for older stock.
Deferred maintenance is a balance sheet problem that shows up years later, all at once. Market Briefs covers the economics of homeownership free every morning.
Who pays and who can't
The bill gets bigger as homes age, but the wallet size varies. In 2023, owners of pre-1960 homes averaged $6,000 on improvements and maintenance compared with $4,500 for owners of homes built in 2010 or later, a gap of about 35 percent that holds across income groups. Among residents of the oldest properties, households in the top income quintile had average 2023 improvement and repair spending of $12,700, versus $3,400 for the bottom quintile.
No matter the age of the home, higher earners spend more than lower earners. In fact, higher-income owners put an average of $7,400 into homes built since 2010, more than twice what lower-income owners spent on homes built before 1960. For context, the lowest income quintile is under $37,500 and the highest is over $172,000.
Repairs, risks, and what it means for you
Years of underinvestment have left many homes in rough shape. In 2023, about 2.9 million homeowner households, or 3.3 percent, lived in places HUD classifies as moderately or severely inadequate, meaning multiple structural issues like water leaks, large cracks, or floor holes, or serious problems with plumbing, electrical, or heating. The inadequacy rate hit 5.4 percent for pre-1960 homes, compared with 1.3 percent for owner-occupied properties constructed in 2010 or later.
A 2025 analysis from the Federal Reserve Bank of Philadelphia estimated that in 2024, 48 percent of owner-occupied dwellings built before 1940 required at least one repair, versus 26 percent for those built in 2000 or later. The same report put average estimated repair costs at $5,200 per older home and $3,600 per newer home, with a total repair tab of $23.9 billion for owner-occupied homes built before 1940.
Keeping older homes in shape matters for affordability, too. Lower-value, older properties make up a big share of the options for lower-income buyers. In 2023, among the lowest income quintile, 29 percent owned homes built before 1960. Falling behind on repairs can snowball into emergencies, dent home values, and expose residents to hazards like lead exposure, mold, fire hazards from faulty wiring, structural injuries, and unsafe indoor temperatures.
There is some policy movement. In 2023, Pennsylvania's Whole-Home Repairs Program emerged as the first statewide program to provide repair funding to lower-income homeowners and to rental property owners. Federally, the 21st Century ROAD to Housing Act creates a pilot program that provides grants to income-eligible homeowners to address habitability, safety, accessibility, and weatherization improvements. Still, today's funding is small next to the scale of needs, which for the oldest homes alone amounts to tens of billions of dollars.
What does this mean for your money? Older houses generally pull more of your budget into maintenance and replacements as systems age, while the benefits of timely fixes show up in fewer emergencies and steadier home values. Big picture, widespread deferred maintenance shapes neighborhood values and the supply of entry-level homes.
An older housing stock changes what buyers, owners, and insurers are all paying for. Get the free Market Briefs daily newsletter and follow the trend.