How the researchers measured insurance strain
University of Southern California economists Matthew E. Kahn and Wesley A. Miller created the Local Insurance Strain Index, or LISI, using ZIP code level data from 2018 through 2022. LISI combines three dimensions of homeowners insurance stress: affordability, measured as premiums compared with homeowner income; availability, gauged using insurer nonrenewal rates; and profitability, tracked as paid losses relative to premiums. Most of the underlying information comes from the Treasury Department's Federal Insurance Office.
Coverage is broad, spanning about 70% of ZIP Code Tabulation Areas and roughly 87% of the U.S. population. At a national view, places facing hazards like wildfire, tornadoes, and floods tend to show steeper premiums relative to income and greater challenges keeping coverage in place.
The urban pattern inside metros
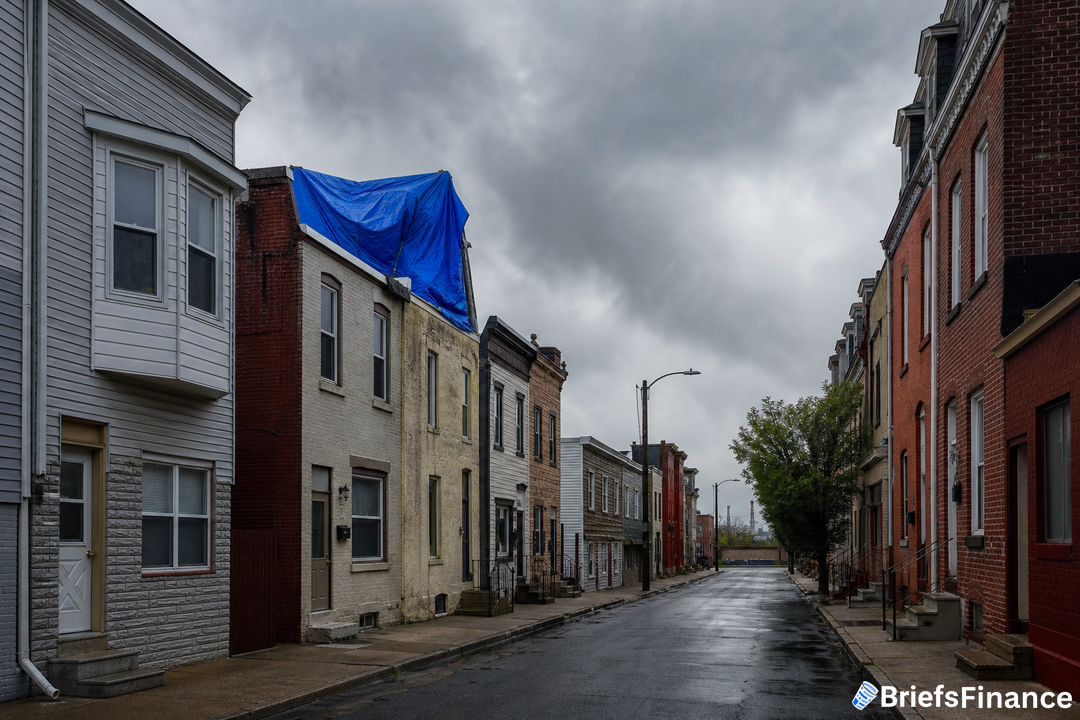
Looking within metro areas, environmental exposure typically rises as you get farther from the main business district. Yet insurance strain moves the other way. It peaks in the city center, falls quickly within roughly five miles of downtown, then stays relatively steady across the suburbs. Inside the same metro, ZIP codes close to the core experience insurer nonrenewal rates about 20% higher than suburbs located more than five miles out, and average premiums in core ZIP codes run 39% higher than those suburban areas.
Those gaps are not the result of outsized insurer profits in cities. Paid loss ratios look broadly similar between urban and suburban ZIP codes, which points to higher urban premiums tracking with higher losses rather than extra margin for insurers.
Why city insurance costs can run hot even with lower measured hazard
The study highlights risks that usually sit outside the climate conversation. Theft and burglary show up more often in dense areas. Older housing stock can drive more claims tied to plumbing, appliances, and building systems. Repairs in cities can also be pricier due to higher labor and materials costs, stricter building codes, and the complexity of working on older structures.
Insurance market design can widen the gap. In many places prone to disasters, public programs shoulder some of the biggest catastrophe exposures. The National Flood Insurance Program covers flood risk, state windstorm pools target wind, and state FAIR Plans help with other environmental perils.
Rising local risks remind investors to review how they protect and grow savings. Join Briefs Finance CEO Jaspreet Singh on September 29th for a FREE live investor workshop, How to Profit From A Dollar That's Losing its Value, where he shows how we're spotting investment opportunities as the dollar falls. Save your spot.
These backstops matter a lot in some suburban and outlying communities, including wildfire zones in California and coastal stretches of Texas and Florida. Urban owners, however, typically do not have parallel public programs for risks linked to dense living, older structures, crime, and expensive repairs. The result is an imbalance where policy helps spread catastrophe costs, while many city specific risks remain squarely in the private market.
What it does to housing values, and what that means for your money
The authors test whether local insurance strain shows up in home values and rents, and they find strong links. In ZIP codes with both home price and rent data, a one standard deviation increase in strain lines up with a 10.6% decline in single family home prices and a 3.1% drop in multifamily rents. The price to rent ratio falls 7.5%.
The pattern is most pronounced near the core, with the same increase in strain tied to a 19.1% slide in single family prices and a 6.2% drop in multifamily rents. These relationships fade with distance and are close to zero by around 30 miles from downtown.
The authors stress these are relationships, not proof that insurance strain alone moves prices or rents. Insurance strain can reflect local factors such as crime, building quality, or other environmental downsides that also shape housing demand. Still, two mechanisms fit the data: higher premiums and patchier coverage increase the cost and uncertainty of owning, which trims what buyers will pay for single family homes, and the underlying local conditions that trigger claims can make an area less appealing for both owners and renters.
Their takeaway reframes today's insurance crunch as a within metro story. A big share of homeowners losses comes from non environmental risks concentrated in city centers. So efforts to ease urban housing affordability should weigh insurance affordability and availability when considering tools like rate regulation, residual market expansion, and zoning. What drives the cost to insure property in cities are local factors - crime, the makeup of the building stock, infrastructure, and the liability climate - that often sit beyond standard insurance policy levers.
What this means for your wallet: insurance pressure is showing up the most in central city ZIP codes and is visible in nearby home values and rents, with the effect tapering as you move outward. If you keep tabs on urban real estate exposure, insurance strain is a local variable worth watching.
Keeping a steady plan helps your wealth weather changes in housing and insurance. Our CEO Jaspreet Singh is hosting a FREE live investor workshop, How to Profit From A Dollar That's Losing its Value, on September 29th. Sign up free to join him live.