Free NewsletterPro Login
Free Live Investors Workshop
Seats limited
Tue, Sep 29.
The dollar is losing value.
Here’s how investors can still profit.
Hosted By
Jaspreet Singh
Founder, Briefs Finance
X

Warning: Undefined variable $stocks in /var/www/briefs.co/htdocs/wp-content/plugins/oxygen/component-framework/components/classes/code-block.class.php(133) : eval()'d code on line 448

Warning: foreach() argument must be of type array|object, null given in /var/www/briefs.co/htdocs/wp-content/plugins/oxygen/component-framework/components/classes/code-block.class.php(133) : eval()'d code on line 448

Warning: Undefined variable $funds in /var/www/briefs.co/htdocs/wp-content/plugins/oxygen/component-framework/components/classes/code-block.class.php(133) : eval()'d code on line 472

Warning: foreach() argument must be of type array|object, null given in /var/www/briefs.co/htdocs/wp-content/plugins/oxygen/component-framework/components/classes/code-block.class.php(133) : eval()'d code on line 472
/* the link was here */

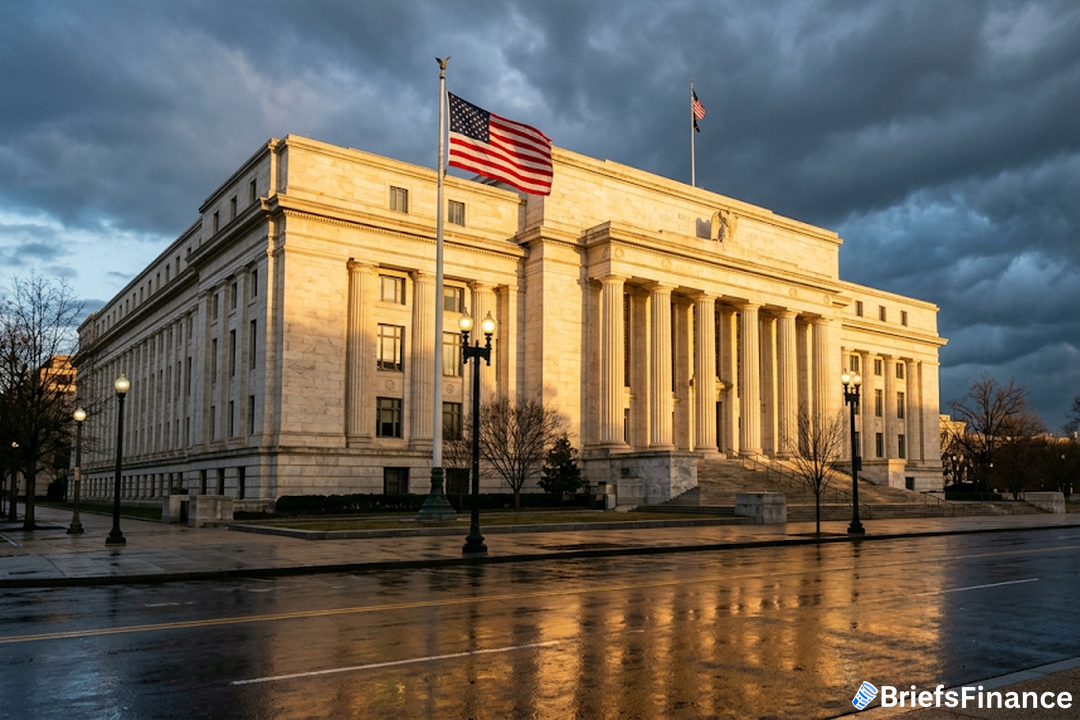
The Treasury's Own Data Shows Insurance Is Deciding Where Americans Can Live

Published Jun 21, 2026
Share:
Summary:
  • A U.S. Treasury report studied home insurance markets from 2018 to 2022 using ZIP-level data from more than 330 insurers.
  • Premiums rose 8.7% faster than inflation over that period.
  • Costs and dropped-coverage rates were highest in the ZIP codes most exposed to climate risk.

Insurance used to be a footnote at the closing table.

Now the government's own data tells a bigger story. It says insurance is starting to decide where Americans can afford to live.

That is a major shift, and it came from the Treasury.

What The Government Found

The Treasury's Federal Insurance Office studied the home insurance market. It looked at the years from 2018 to 2022.

The team pulled ZIP-level data from more than 330 insurers, its report shows. The finding was clear.

Bills rose 8.7% faster than inflation over those years. And the pain was not spread evenly.

The highest costs showed up in the riskiest places. So did the most dropped policies.

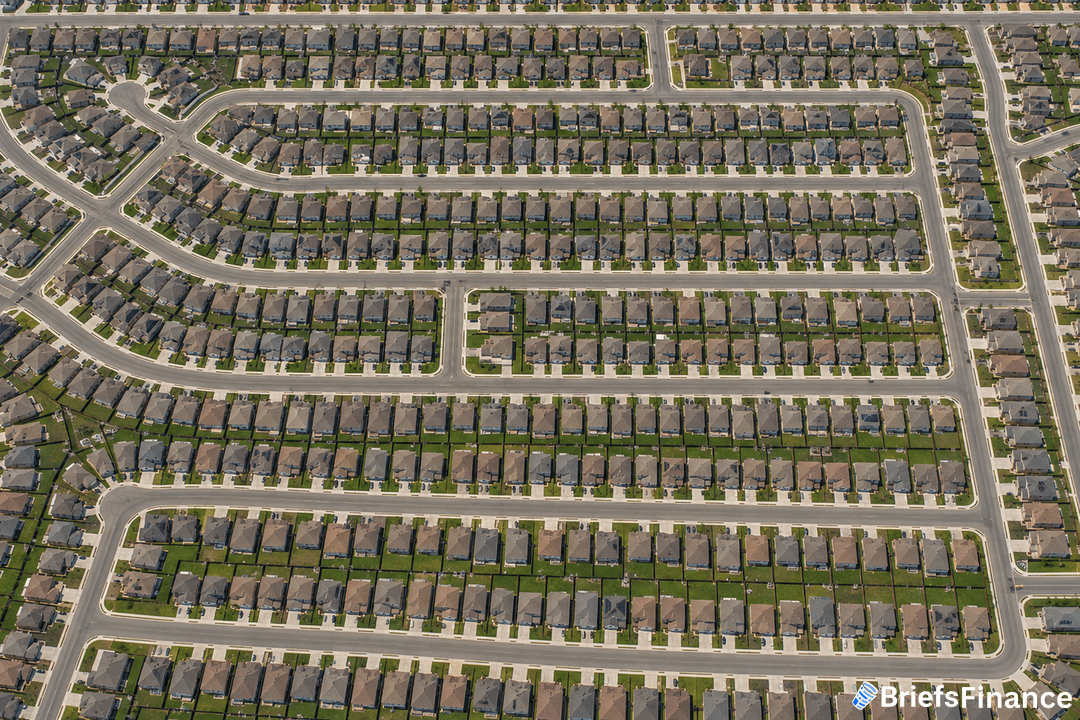
All of it clustered in the same ZIP codes. These were the ones most exposed to fires, storms, and floods.

That overlap is the whole point. Where the risk is worst, coverage is both priciest and hardest to keep.

We turn dense government reports into plain English in Market Briefs, and signing up gets you a free investing masterclass.

The Real Question Is Changing

For years, a buyer asked one thing. What does it cost to insure this place?

In a growing list of ZIP codes, the question is harder now. Can you insure it at all?

A rate cut can ease the mortgage. But it cannot make a home insurable.

That is why insurance, not interest, now sets the limit. It decides what people can buy in the wider housing market.

Why It Matters For Your Money

A home you cannot insure is a home you cannot get a loan on. That can freeze prices in the riskiest areas.

It can also push buyers toward safer ground. Over time, that reshapes which towns hold their value.

So the risk map and the price map start to merge. Investors should watch both together.

Why The Data Is New

This was a first-of-its-kind look. The data came through state regulators, known as the NAIC.

It covered hundreds of insurers at the ZIP level. That detail had never been public before.

Drop rates told the same story as prices. When insurers drop you, it happens most in risky areas.

Lenders require coverage on a mortgage. So no coverage often means no loan.

That links insurance straight to home values. A house you cannot insure is hard to sell.

It is also hard to finance. Buyers need a loan, and lenders need coverage.

Break that chain, and the sale can stall. The report shows where that chain is fraying.

It is fraying fastest in the riskiest ZIP codes. Outside analysts at Brookings read the data the same way.

Worth Noting

The same Treasury data is public and broken out by ZIP code. Buyers can check the risk in an area before they make an offer.

The map of where Americans can afford to live is being redrawn. Insurance is holding the pen.

For more stories that explain what the data really means, read Market Briefs each morning. It is free, and a 45-minute investing course comes with it.

Disclosure

Recent News

1 2 3 82

Get Market Briefs delivered to your inbox every morning for free!

No fluff. No noise. No politics. Just finance news you can read in 5 minutes.

Blogs

September 21, 2026
How the Federal Reserve Makes Money - and Why It Just Posted Its Biggest Loss Ever
  • For 109 years the Federal Reserve created money, lent it to the U.S. government and handed the interest it collected back to Washington - almost $1 trillion in the decade starting in 2011.
  • Pandemic-era lending locked the Fed into earning about 2% on trillions of dollars while it now pays banks around 4%, producing a record loss of hundreds of billions in 2026.
  • The Fed covers its losses by creating money and the government covers its lost revenue by borrowing, and both feed the inflation that eats at the dollars in your account.
Read More
September 18, 2026
Kevin Warsh Just Defied Trump: What the Fed Rate Hike Means for Your Money
  • The Fed raised rates for the first time since 2023 in a unanimous vote led by Kevin Warsh, the chairman President Trump appointed to cut them.
  • Higher rates make the $40 trillion national debt, business loan resets and mortgages more expensive, but they strengthen the dollar and pay investors holding cash.
  • The war with Iran is pushing up oil, grocery and chip prices, another hike is likely in 2026, and recession talk is about to get louder.
Read More
September 17, 2026
Why America Bailed Out the Yen: The Japan Carry Trade, the Dollar and Your Mortgage Rate
  • In July 2026 the US sent money to steady the yen because Japan is the largest foreign owner of US debt, and Washington needs Japan to keep lending.
  • For decades the Japan carry trade let Wall Street borrow yen at essentially 0% and pour it into US stocks, real estate and Treasuries, and rising Japanese rates are shutting that off.
  • A weaker yen means fewer buyers for the dollar and for US debt, which pushes Treasury rates up and drags mortgage, car loan and credit card rates up with them.
Read More
September 16, 2026
Treasury Yields Are Spiking Because Lenders Are Backing Away From U.S. Debt
  • The U.S. is paying its highest 30-year borrowing rate in about two decades because its biggest lenders, the Fed, foreign governments, and banks, are all pulling back from Treasuries.
  • Every mortgage, car loan, credit card, and business loan is priced off the 10-year Treasury yield, so when Washington pays more to borrow, so do you.
  • With about $40 trillion of debt against a $32 trillion economy, the country either outgrows its debt or slides into a doom loop, and investors need a plan for both.
Read More
September 15, 2026
Fiat Currency Runs on Trust, and the World Just Stopped Trusting the Dollar
  • Gold has overtaken US treasuries as the world's top reserve asset, and central banks are now buying less US debt and more gold.
  • The US dollar is a fiat currency, meaning it's backed by a promise rather than gold, so it loses value when fewer countries want to hold it.
  • Whether the US economy or its national debt grows faster from here decides which assets stand to benefit next.
Read More
September 14, 2026
Why RAM Prices Are Soaring - and Where the Money Is Moving
  • Memory chips - the RAM inside phones, laptops, fridges, and trucks - are in a shortage Tim Cook called a 100-year flood, and some memory prices have climbed about 90% in a single quarter.
  • Four forces hit at once: AI demand, a production shutdown in 2023, build times that push any fix to 2028 at the earliest, and a bombed helium plant in Qatar.
  • The last two supply shocks ended in aggressive Fed rate hikes and market drops of around 45% and 20%, and this time Washington is spending heavily to bring memory production home.
Read More
September 11, 2026
How Is the Economy Doing? Washington Says It's Fixed, but the Numbers Don't Agree
  • Treasury Secretary Scott Bessent says the economy is fixed because lower earners' incomes are now rising faster than top earners'.
  • The Atlanta Fed and Bank of America show different numbers, and Hilton, Marriott, and McDonald's can't agree on what they're seeing either.
  • Whichever side is right, the economy is built to make investors rich, and inflation is how it does it.
Read More
September 10, 2026
US National Debt Hits $40 Trillion: Why the Economy Hasn't Collapsed Yet
  • The US national debt crossed $40 trillion in 2026 and is growing faster than the economy. The debt to GDP ratio now sits at 125%, the highest outside the pandemic and higher than World War II.
  • On September 9, 2026, Treasury Secretary Scott Bessent rolled out an emergency plan for the government to lend money to itself. Ray Dalio now says the dollar has roughly three years before real pain.
  • Empires rarely default. They debase. Since 1971, median household income grew about 8x while houses grew 17x and the S&P 500 grew 360x, so investors got richer while workers fell behind.
Read More
September 9, 2026
Your 401k Is Fueling the AI Bubble
  • About $10 trillion of 401k money sits in a $77 trillion stock market, mostly through target date funds and S&P 500 funds. Roughly 30% of every S&P 500 dollar lands in five AI-heavy tech stocks.
  • Four bubble signals run hotter today than before the 2000 crash: top-ten concentration, tech's share of the index, the Buffett Indicator, and how much of the market index funds own.
  • You only lock in an AI bubble loss if you sell. The 2022, 2020, 2008, and 2000 crashes were all buying windows for long-term investors, and the US-China AI race means government money could keep flowing in.
Read More
September 9, 2026
What Is Wealth Preservation? How To Protect Your Money From Anything
  • Wealth preservation is an investing strategy built around keeping the money you've already made instead of chasing growth.
  • It leans on assets that hold steady when markets fall - gold, Treasury bonds, and companies that keep earning through wars, crashes, and pandemics.
  • The tradeoff is real: you give up some upside, and the two key numbers to check are maximum drawdown and correlation to the market.
Read More
1 2 3 27
Share via
Copy link