Free NewsletterPro Login

Bitcoin’s Current Pull Back Has Some Experts Worried

A stylized illustration of a cylindrical cup with blue arrows and lines indicating a swirling or rotational motion inside the cup.
Published Mar 22, 2026
Share:
A large gold Bitcoin token is shown cracked into several pieces against a dark background, reflecting a recent Bitcoin pull back, with a BriefsFinance logo in the bottom right corner.
Summary:
  • Bitcoin's chart is tracing the same sluggish bounce pattern that showed up right before prices collapsed from $90,000 to $60,000 earlier this year
  • The coin is down 18% on the year and roughly 41% off its record near $126,000 - the worst opening stretch for any year in Bitcoin's history
  • But each time Bitcoin has finished a calendar year in the red since 2013, what followed was a big recovery - and April tends to be one of its strongest months

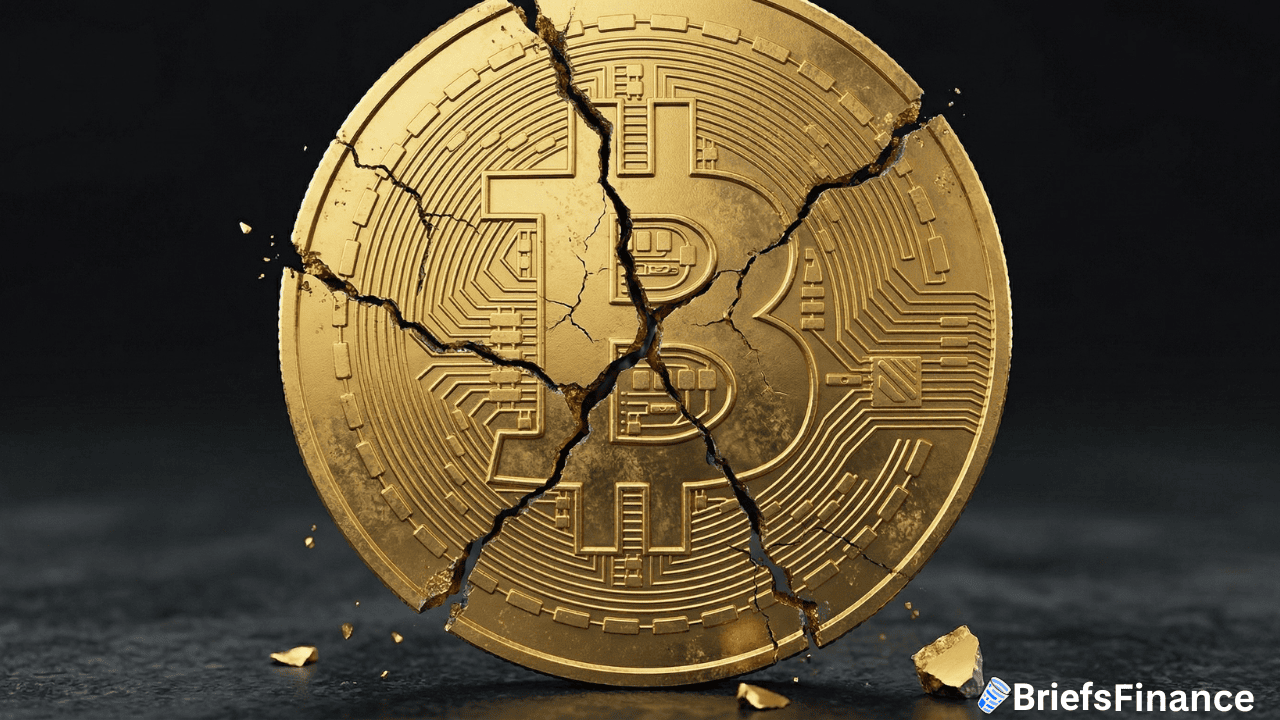
The coin is hovering around $67,000 after going red five months in a row - a losing run it hasn't matched since the brutal 2018-2019 stretch. 

But the part that has traders on edge isn't the losing streak. It's that the bounce might be a little too familiar. 

The Pattern Some Investors Are Seeing

Since bottoming out in early February, Bitcoin has moved a bit higher.

That matters because the exact same setup played out between late November and mid-January. 

Back then, the coin drifted higher in a tight range after falling from $100,000.

Then, prices went straight down to roughly $60,000 in a matter of days.

The current bounce has the same fingerprints - slow and choppy, with no real energy from buyers stepping in on dips.

Technical analysts call this a counter-trend recovery - a brief pause that tricks investors into thinking the worst is over. 

If the lower edge of the current range gives way around $65,800, that illusion could break fast.

Why Some Crypto Investors Are Hopeful

Spot Bitcoin ETFs - funds that hold the actual coin - lost nearly $4 billion in investor money during the first five weeks of 2026.

But the 2014 downturn gave way to a 35% rally. 

The 2018 collapse saw  95% come back later. 

And after the 2022 meltdown, prices more than doubled - climbing 156%.

Put those together and you get an average rebound of roughly 95% every time investors were ready to write it off.

Now, that’s not to say it’s guaranteed to come back - but it has some investors hopeful the trend will continue.

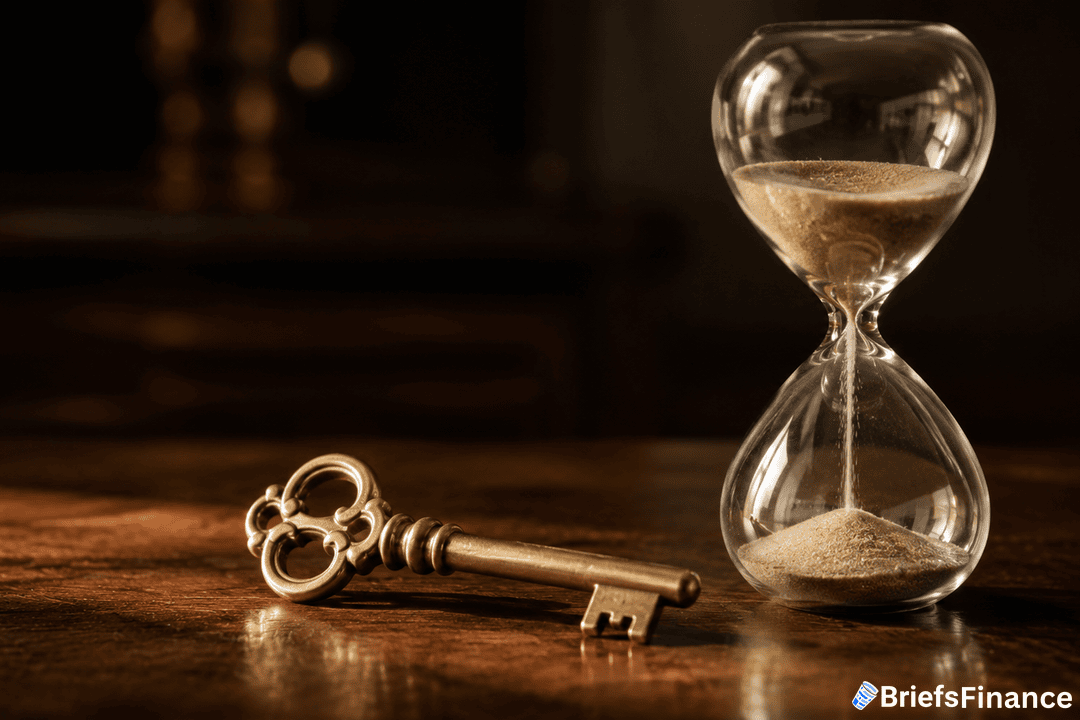
Why April Could be Important

Looking back at the last 13 years, April has closed higher more often than not - eight times out of 13. The average move during the month sits around 13%.

That doesn't guarantee anything - and there's no major catalyst on the horizon, with the next halving still two years out in 2028. 

If the chart pattern breaks to the downside, the selling could get worse before it gets better.

If it breaks higher, the bears lose their grip - and the worst start to a year on record turns into a buying opportunity that looks obvious in hindsight.

One of them will be wrong inside the next two weeks.

Disclosure

Get Market Briefs delivered to your inbox every morning for free!

No fluff. No noise. No politics. Just finance news you can read in 5 minutes.

Blogs

May 30, 2026
Financial Literacy Books That Actually Build Wealth
  • The best financial literacy books don't just teach budgeting, they shift how you think about money.
  • Two classics stand out: The Intelligent Investor for valuing investments, and Rich Dad Poor Dad for the owner's mindset.
  • Reading is only step one. The real wealth comes from acting on what you learn.
Read More
May 30, 2026
What Is a Roth Conversion? A Simple Guide
  • A Roth conversion moves money from a traditional retirement account into a Roth account.
  • You pay taxes on the money now, in exchange for tax-free growth and withdrawals later.
  • It can pay off if you expect higher taxes or more income in the future, but the timing and tax hit matter a lot.
Read More
May 30, 2026
Trailing Stop Loss: How to Protect Your Gains
  • A trailing stop loss is an order that automatically sells a stock if it falls a set percentage from its recent high.
  • As the stock rises, the sell point rises with it, locking in gains while capping losses.
  • It's most useful for active strategies like momentum investing, not for long-term buy-and-hold.
Read More
May 30, 2026
5 Types of Wealth: Why Money Is Only One of Them
  • Real wealth is more than a bank balance. It spans your finances, health, mind, purpose, and freedom.
  • Money is powerful, but it amplifies the life you already have rather than fixing a broken one.
  • True financial wealth means your cash flow covers your expenses, so your money works while you live.
Read More
May 30, 2026
How to Invest in Private Equity: A Beginner's Guide
  • Private equity means investing in companies that aren't listed on the stock market.
  • Traditional private equity is built for experienced, high-net-worth investors with large amounts to invest.
  • New rules have opened more accessible paths, like startup crowdfunding and real estate deals, often starting around $100.
Read More
May 30, 2026
What Is a Call Option? A Simple Guide With Examples
  • A call option gives you the right to buy a stock at a set price by a set date.
  • Investors buy calls when they expect a stock to rise, using less money than buying the shares outright.
  • The most you can lose buying a call is the premium, but time works against you, so it's an advanced tool.
Read More
May 30, 2026
EBITDA Formula: How to Calculate It Step by Step
  • EBITDA stands for Earnings Before Interest, Taxes, Depreciation, and Amortization, a measure of a company's core profit.
  • The formula adds those four items back to net income to show what the underlying business earns.
  • Investors use EBITDA to compare companies and to judge how many times earnings a stock is selling for.
Read More
May 30, 2026
What Is a Stock Option? A Plain-English Guide
  • A stock option is a contract giving you the right, but not the obligation, to buy or sell a stock at a set price by a set date.
  • There are two types: calls (the right to buy) and puts (the right to sell).
  • Options are powerful but risky, so they suit investors who already have the basics down.
Read More
May 30, 2026
Put Option: What It Is and How It Works
  • A put option gives you the right to sell a stock at a set price by a set date.
  • Investors use puts to bet a stock will fall, or as insurance to protect shares they own.
  • The most you can lose buying a put is the premium you paid, which makes it a defined-risk tool.
Read More
May 30, 2026
Operating Margin: What It Is and How to Calculate It
  • Operating margin shows how much profit a company keeps from its core business after paying its running costs.
  • The formula is operating income divided by revenue, shown as a percent.
  • A strong, steady operating margin signals a well-run business that controls its costs.
Read More
1 2 3 22
Share via
Copy link