Free NewsletterPro Login

Warning: Undefined variable $stocks in /var/www/briefs.co/htdocs/wp-content/plugins/oxygen/component-framework/components/classes/code-block.class.php(133) : eval()'d code on line 448

Warning: foreach() argument must be of type array|object, null given in /var/www/briefs.co/htdocs/wp-content/plugins/oxygen/component-framework/components/classes/code-block.class.php(133) : eval()'d code on line 448

Warning: Undefined variable $funds in /var/www/briefs.co/htdocs/wp-content/plugins/oxygen/component-framework/components/classes/code-block.class.php(133) : eval()'d code on line 472

Warning: foreach() argument must be of type array|object, null given in /var/www/briefs.co/htdocs/wp-content/plugins/oxygen/component-framework/components/classes/code-block.class.php(133) : eval()'d code on line 472
/* the link was here */
Free Live Investor Workshop
The dollar is losing value. Here’s how investors can still profit. Click Here to Save Your Seat →         

Warsh Leaves His Dot Blank Again, Putting the Fed's Favorite Chart Under Fresh Scrutiny

Published Sep 16, 2026
Share:
Summary:
  • The Fed's quarterly "dot plot" shows anonymous rate projections from as many as 19 policymakers, and investors fixate on the median dot.
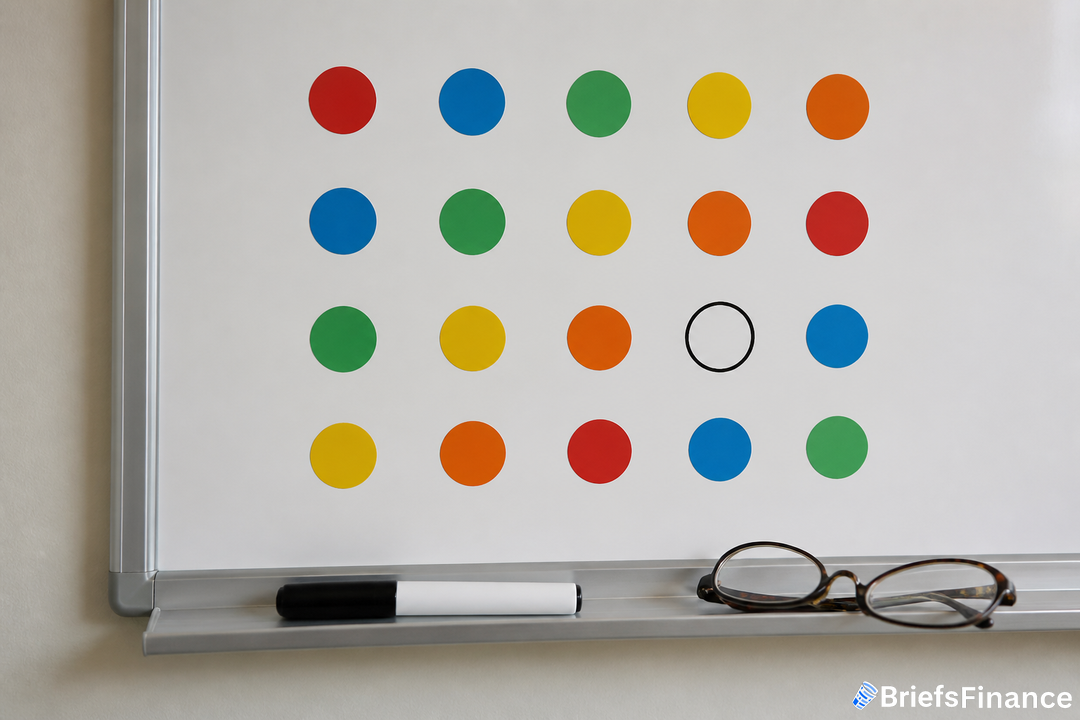
  • Chairman Kevin Warsh skipped submitting a dot in June and again on Sept. 16, leaving just 18 projections in the latest charts spanning the balance of 2026 and 2027.
  • A new Fed communications panel is weighing whether the dot plot should stick around, as Warsh pushes for giving less forward guidance.

The Dot Plot, Decoded

Think of the dot plot as the Fed's group forecast board for the federal funds rate, the short-term rate it steers. Up to 19 officials can post a dot: the Board of Governors in Washington (as many as seven seats) plus the 12 heads of the regional Reserve Banks. Each participant marks a dot indicating their view of the appropriate midpoint of the policy range at year-end for the coming three calendar years, plus one for the longer-run setting. Markets tend to home in on the middle dot.

The chart was introduced in late 2011, when then Chair Ben Bernanke and his deputy, Janet Yellen, wanted to give the public a window into policymakers' outlook beyond the immediate rate decision.

Why the Dots Matter Now

When the dots shift, they can send a strong signal about whether officials anticipate raising or cutting rates, and they offer a reference point to compare Fed thinking with market expectations. FOMC statements still focus on current conditions and the near-term target, but the dots extend the view.

We have seen the plot steady market takes before. In June 2023, officials held the policy rate unchanged, and the dots pointing to additional hikes later that year helped cool any rush to call the tightening campaign finished.

Warsh's No Dot and the Communications Review

September's chart featured 18 projections and, as usual, no names attached. It also showed a few differences among forecasts. The count was one short because Kevin Warsh declined to contribute a dot, repeating what he did at his first rate-setting meeting as chair in June. Following the most recent move to lift borrowing costs by 0.25 percentage point, he called it "a sober decision, serious decision, responsible decision, one that we have been preparing for and thinking about in my hundred and ten or twenty days here."

The anonymity of the dots is a feature that divides opinion, and it means you cannot match a projection to a person just by looking. Detractors add that the dots are not an official committee forecast. Staff weighed creating a single consensus dot, but officials judged it would be too hard to nail down across members using different models and assumptions. Another complication: only five of the 12 regional bank presidents vote on the FOMC in a given year, which clouds how closely the dots line up with voting outcomes over time.

When guidance changes, steady planning helps protect and grow your savings. Join Briefs Finance CEO Jaspreet Singh on September 29th for a FREE live investor workshop, How to Profit From A Dollar That's Losing its Value, where he shows how we're spotting investment opportunities as the dollar falls. Save your spot.

How Leaders Have Viewed the Dots and What It Means For Your Money

At his June 17 press conference, Warsh said he didn't submit a dot, argued the exercise isn't useful for conducting policy, and noted that a year-end review of Fed communications - including the dots - is in the works. Views have varied before him. In 2014, during her first press briefing as chair, Yellen cautioned that the committee didn't intend the dot plot to be the primary channel for communicating policy to the broader public.

In 2016, when officials pared their expected number of rate hikes that year to two from four, she explained that the change mainly reflected a softer outlook for global growth and tighter credit conditions. Jerome Powell, who became chair in February 2018, often downplayed the dot plot, but it proved useful at times, including June 2023 when a pause paired with higher dots curbed excessive enthusiasm about the end of hikes.

Here is where that leaves your wallet today: the Fed just lifted rates by a quarter point, and the latest dot plot contains 18 entries covering the remainder of 2026 and 2027. The dots do not tell you who thinks what, and they are not a committee promise, but they do show how policymakers collectively see the path right now. That context can help you weigh how borrowing costs and savings yields could evolve as the Fed's outlook changes.

Long term, thoughtful choices and calm discipline are what safeguard your financial future. Our CEO Jaspreet Singh is hosting a FREE live investor workshop, How to Profit From A Dollar That's Losing its Value, on September 29th. Sign up free to join him live.

Disclosure

Recent News

1 2 3 78

Get Market Briefs delivered to your inbox every morning for free!

No fluff. No noise. No politics. Just finance news you can read in 5 minutes.

Blogs

September 16, 2026
Treasury Yields Are Spiking Because Lenders Are Backing Away From U.S. Debt
  • The U.S. is paying its highest 30-year borrowing rate in about two decades because its biggest lenders, the Fed, foreign governments, and banks, are all pulling back from Treasuries.
  • Every mortgage, car loan, credit card, and business loan is priced off the 10-year Treasury yield, so when Washington pays more to borrow, so do you.
  • With about $40 trillion of debt against a $32 trillion economy, the country either outgrows its debt or slides into a doom loop, and investors need a plan for both.
Read More
September 15, 2026
Fiat Currency Runs on Trust, and the World Just Stopped Trusting the Dollar
  • Gold has overtaken US treasuries as the world's top reserve asset, and central banks are now buying less US debt and more gold.
  • The US dollar is a fiat currency, meaning it's backed by a promise rather than gold, so it loses value when fewer countries want to hold it.
  • Whether the US economy or its national debt grows faster from here decides which assets stand to benefit next.
Read More
September 14, 2026
Why RAM Prices Are Soaring - and Where the Money Is Moving
  • Memory chips - the RAM inside phones, laptops, fridges, and trucks - are in a shortage Tim Cook called a 100-year flood, and some memory prices have climbed about 90% in a single quarter.
  • Four forces hit at once: AI demand, a production shutdown in 2023, build times that push any fix to 2028 at the earliest, and a bombed helium plant in Qatar.
  • The last two supply shocks ended in aggressive Fed rate hikes and market drops of around 45% and 20%, and this time Washington is spending heavily to bring memory production home.
Read More
September 11, 2026
How Is the Economy Doing? Washington Says It's Fixed, but the Numbers Don't Agree
  • Treasury Secretary Scott Bessent says the economy is fixed because lower earners' incomes are now rising faster than top earners'.
  • The Atlanta Fed and Bank of America show different numbers, and Hilton, Marriott, and McDonald's can't agree on what they're seeing either.
  • Whichever side is right, the economy is built to make investors rich, and inflation is how it does it.
Read More
September 10, 2026
US National Debt Hits $40 Trillion: Why the Economy Hasn't Collapsed Yet
  • The US national debt crossed $40 trillion in 2026 and is growing faster than the economy. The debt to GDP ratio now sits at 125%, the highest outside the pandemic and higher than World War II.
  • On September 9, 2026, Treasury Secretary Scott Bessent rolled out an emergency plan for the government to lend money to itself. Ray Dalio now says the dollar has roughly three years before real pain.
  • Empires rarely default. They debase. Since 1971, median household income grew about 8x while houses grew 17x and the S&P 500 grew 360x, so investors got richer while workers fell behind.
Read More
September 9, 2026
Your 401k Is Fueling the AI Bubble
  • About $10 trillion of 401k money sits in a $77 trillion stock market, mostly through target date funds and S&P 500 funds. Roughly 30% of every S&P 500 dollar lands in five AI-heavy tech stocks.
  • Four bubble signals run hotter today than before the 2000 crash: top-ten concentration, tech's share of the index, the Buffett Indicator, and how much of the market index funds own.
  • You only lock in an AI bubble loss if you sell. The 2022, 2020, 2008, and 2000 crashes were all buying windows for long-term investors, and the US-China AI race means government money could keep flowing in.
Read More
September 9, 2026
What Is Wealth Preservation? How To Protect Your Money From Anything
  • Wealth preservation is an investing strategy built around keeping the money you've already made instead of chasing growth.
  • It leans on assets that hold steady when markets fall - gold, Treasury bonds, and companies that keep earning through wars, crashes, and pandemics.
  • The tradeoff is real: you give up some upside, and the two key numbers to check are maximum drawdown and correlation to the market.
Read More
September 8, 2026
Why Is Everything So Expensive? Why Prices May Never Come Back Down
  • Official inflation is 3.4% and prices are up 32% since 2020, but rent (41%), gas (47%), car insurance (64%) and ground beef (79%) all outran the 28% median wage.
  • The Federal Reserve targets 2% inflation on purpose. Rising prices push extra dollars to investors and shrink the real cost of a $40 trillion national debt.
  • Investors who simply owned the S&P 500 gained about 150% over the same six years, and the Fed's September 16 decision will show whether it protects the dollar or the economy first.
Read More
September 7, 2026
The U.S. Housing Market Just Flipped: Renting a Home Now Beats Buying One
  • The US is in a buyer's market in 41 of the 50 largest metro areas, but prices sit near record highs and mortgage rates are close to 7%.
  • The same median house costs 27% more than it did in 2021 while the monthly payment costs 90% more, and incomes rose a little more than 10%.
  • A 2008-style crash is not showing up in the data, so the pressure is landing on buyers instead of prices.
Read More
September 4, 2026
An Interest Rate Hike in 2026? The Fed Just Broke Its Own Script
  • The Federal Reserve spent a year signaling cheaper money, and its new chairman just warned that an interest rate hike may be coming instead.
  • The Fed is stuck between high inflation and a weak job market, and fixing one makes the other worse.
  • Higher rates also reprice roughly a third of America's $40 trillion national debt this year, which is why Washington wants cuts so badly.
Read More
1 2 3 26
Share via
Copy link