Free NewsletterPro Login

The Inflation Headline Was Scary. The Actual Data, Not So Much.

A stylized illustration of a cylindrical cup with blue arrows and lines indicating a swirling or rotational motion inside the cup.
Published Mar 2, 2026
Share:
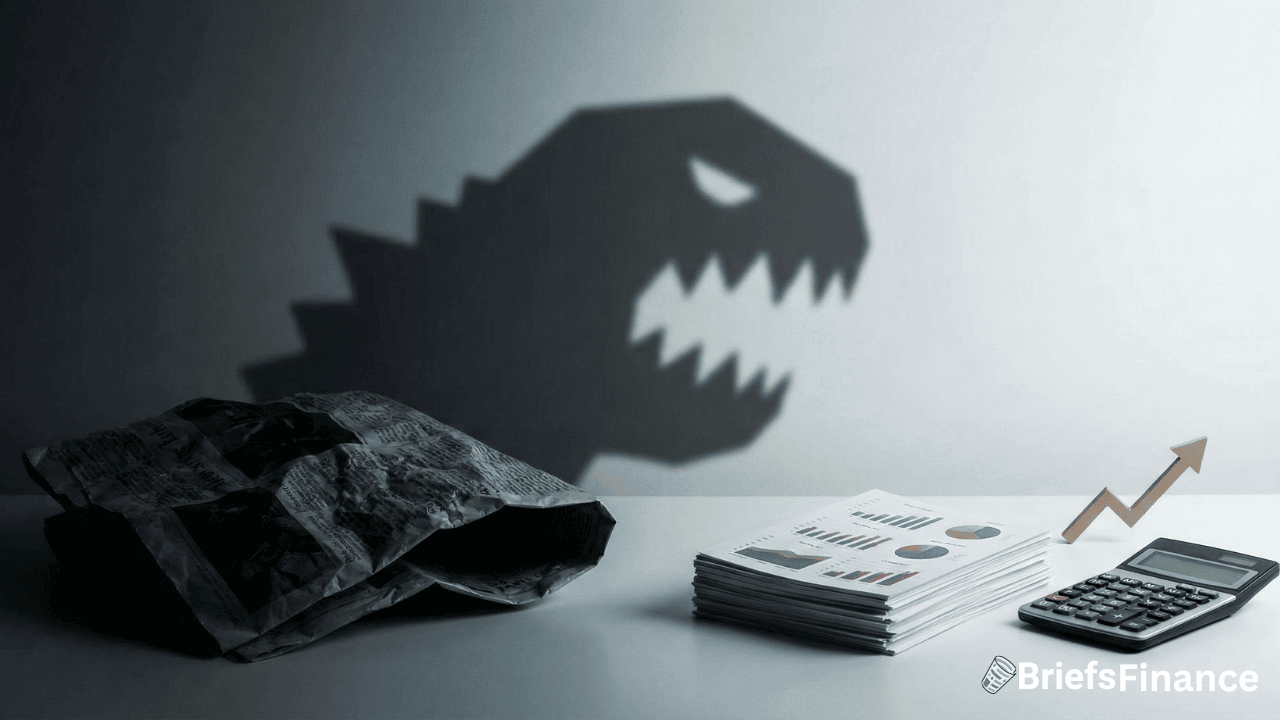
A crumpled newspaper with an inflation headline casts a dinosaur-shaped shadow beside financial reports, a calculator, and an upward arrow, symbolizing market fears.
Summary:

    • January's Producer Price Index came in "hotter than expected" — but the details tell a calmer story.

    • Goods prices actually fell in January; the spike came from a single volatile category in services.

    • Core inflation — the number the Fed actually watches — came in exactly as expected.

Every few weeks, an inflation report drops and the headlines scream. This week it was the PPI. Here's what the number actually said.

What Happened

The Producer Price Index — which tracks what businesses pay before those costs reach consumers — rose 0.5% in January. Analysts expected 0.3%. Cue the alarm bells.

But zoom out for a second. Producer prices are up 2.9% over the past year. That sounds high until you remember they were rising at a 3.8% pace in January 2025. Inflation at the producer level is actually cooler than it was a year ago.

The "hot" headline and the underlying data are telling two very different stories.

Where the Spike Actually Came From

Here's the part the headlines skipped: goods prices fell 0.3% in January. Energy dropped 2.7%. Food fell 1.5%. Those aren't the numbers of an overheating economy.

The jump came entirely from services — specifically a category called "trade services margins," which surged 2.5% in January after rising 1.8% in December. That sounds alarming until you understand what it actually measures.

Trade services margins track the markup that wholesalers and retailers charge — the spread between what they pay for goods and what they sell them for. When that number pops, it usually reflects short-term pricing adjustments or businesses rebuilding profit margins. It doesn't mean raw materials are getting more expensive.

Peter Navarro, writing for RealClearMarkets, put it plainly: this was "a services-side markup adjustment, not evidence of a new supply-chain inflation shock."

What This Means for Your Portfolio

The number Wall Street watches most closely is core PPI — which strips out food, energy, and the volatile trade services category. That came in at exactly 0.3%, right in line with expectations. On a 12-month basis, core PPI sits at 3.4%, slightly below where it was a year ago.

That's not acceleration. That's stability.

The takeaway for investors: one hot headline print doesn't change the trend. Goods prices are falling, core inflation is steady, and the categories driving the spike tend to reverse within a quarter or two. The Fed is watching the same data you are — and what they're seeing doesn't point to a new inflation surge.

Markets may stay nervous. The data says keep calm.
Disclosure

Recent News

1 2 3 … 106

Get Market Briefs delivered to your inbox every morning for free!

No fluff. No noise. No politics. Just finance news you can read in 5 minutes.

Blogs

October 16, 2026
How Boring Math Makes You Rich: The Briefs Money Spreadsheet, Explained
  • Briefs Money shows you what to do with every paycheck, and in what order: how much to spend, save, and invest, when to build an emergency fund, and which debt to pay off first.
  • The Climb to Wealth course walks you through the system step by step, and the Personal Finance Spreadsheet is where you track your own numbers.
  • Investing is one piece of building wealth. The system that gets money to your investments, and keeps it there, decides the outcome.
Read More
October 16, 2026
Common Investing Mistakes: Why a Stock Grade Is One Tool, Not the Whole Toolkit
  • The Briefs Score shows growth, income, and wealth preservation investors how well a stock fits their goal, with a separate letter grade for each one.
  • The most common mistake is treating the letter as an instruction. An A tells you a stock scores well for one goal, not that you should buy today.
  • Research works best as one input in a process you own. The grade shows how a stock stacks up. You supply the goal, the timeline, and the rules for being wrong.
Read More
October 16, 2026
How to Read a Company's Numbers Without a Finance Degree (Using Briefs Terminal)
  • Briefs Terminal lets you size up any public company in about ten minutes: what the stock costs, what it earns, how fast sales are growing, and what it pays you, all on one page.
  • It lines those numbers up against the company's closest competitors for you, so you can tell if a number is impressive or just average.
  • Below that are the income statement, balance sheet, and cash flow statement from the company's SEC filings, the latest news, and transcripts of its earnings calls.
Read More
October 16, 2026
What Type of Investor Am I? The Three Investor Archetypes, Explained
  • Briefs sorts its stock grades and monthly reports by three investor goals: growth, income, and wealth preservation. Pick yours and you know which report and which grade to read first.
  • Growth investors want stocks that beat the S&P 500. Income investors want to get paid in cash. Wealth preservation investors want stocks that hold up when the market drops.
  • The same stock can score an A- for one goal and a D- for another, so picking your goal comes before picking any stock.
Read More
October 16, 2026
How to Build a Stock Watchlist That Isn't Just Stocks You Heard About
  • A watchlist on Briefs Terminal lets you group stocks by the idea you're tracking and follow each one's price, one-day move, and 52-week high and low in one place.
  • Each list has its own name and description, so you always know why a stock is on it, and you can make as many lists as you have ideas.
  • The monthly growth, income, and wealth preservation reports under the Briefs Research tab hand you new themes to track that you didn't hear about online.
Read More
October 16, 2026
How to Choose an ETF That Matches Your Idea (Using the ETF Planning Tool)
  • The ETF planning tool takes an idea like "I want to invest in fast food companies," asks what you mean, and finds the ETFs that match, with the reasons, the holdings, and the sources.
  • Build a Plan then shows what your money could grow to in those ETFs over the years you choose, with conservative, expected, and optimistic estimates next to the S&P 500.
  • It gets you from an idea to an actual plan without researching dozens of companies one at a time.
Read More
October 16, 2026
Is This Stock a Good Buy? How to Use the Briefs Score to Tell If a Stock Fits the Way You Invest
  • The Briefs Score shows growth, income, and wealth preservation investors how well a stock fits their goal, with a separate letter grade for each one.
  • One stock can score very differently for each. Nvidia showed an A- for growth and a D- for income, because it grows fast and pays almost no dividend.
  • Seven sub scores under each grade show what earned the letter, so you can see exactly where a stock is strong or weak for your goal.
Read More
October 16, 2026
How to Tell an Asset From a Liability: The One Question to Ask Before You Buy Anything
  • The typical American household earned more in 2025 than in any year on record, yet only 30% of Americans say they could pay a surprise $1,000 bill from savings, so the problem isn't income but what the income gets spent on.
  • An asset puts money in your pocket and a liability takes money out, and the wealthy buy assets first, then let the assets pay for the fun stuff.
  • Before you buy anything, ask one question: does this put money in my pocket, or take money out of my pocket? Then you need a plan for the money you keep.
Read More
October 16, 2026
How to Build Your First $2,000 Emergency Fund and Wipe Out Every Debt Over 10%
  • Your first money goal isn't investing, it's $2,000 in its own account named Do Not Touch, built by moving 10% of every paycheck into it automatically.
  • More than a third of American adults couldn't cover a $400 surprise bill with cash or savings, according to the Federal Reserve, and that's how one bad day turns into years of credit card payments.
  • Once the $2,000 is there, attack every debt charging more than 10% interest, highest rate first, because you can't out-invest a 22% credit card so paying it off is the investment.
Read More
October 16, 2026
How to Invest Through a Crash: 3 Rules From the Worst-Timed Investor Alive
  • Meet Bunty, a fictional investor with the worst timing in history: he put $100,000 into the market in four chunks right before four crashes, never sold, and by 2025 it had grown to more than $500,000.
  • Investors who jump in and out of the market miss its best days, and missing just a handful of those days can cut your final result roughly in half.
  • The fix is ABB, Always Be Buying: you buy on a schedule through booms, crashes and scary headlines, which matches the market, and beating it takes knowing where the money is moving first.
Read More
1 2 3 … 29
Share via
Copy link