Free NewsletterPro Login
S&P 500 6,287 +0.42%
DOW 44,521 -0.18%
NASDAQ 21,103 +0.71%

Warning: Undefined variable $funds in /var/www/briefs.co/htdocs/wp-content/plugins/oxygen/component-framework/components/classes/code-block.class.php(133) : eval()'d code on line 491

Warning: foreach() argument must be of type array|object, null given in /var/www/briefs.co/htdocs/wp-content/plugins/oxygen/component-framework/components/classes/code-block.class.php(133) : eval()'d code on line 491
/* the link was here */

U.S. Card Debt Tops $1.26 Trillion as Delinquency Rates Jump

Published Aug 11, 2026
[tts_player]
Share:
Summary:
  • U.S. credit card balances hit $1.26 trillion in the second quarter, up $21 billion or 1.7% from the first.
  • Balances more than 90 days overdue jumped to 12.8% from 7.6%.
  • The New York Fed said 6.97% of card balances moved into delinquency over the past year.

Credit Card Debt Is Back Near Its Record

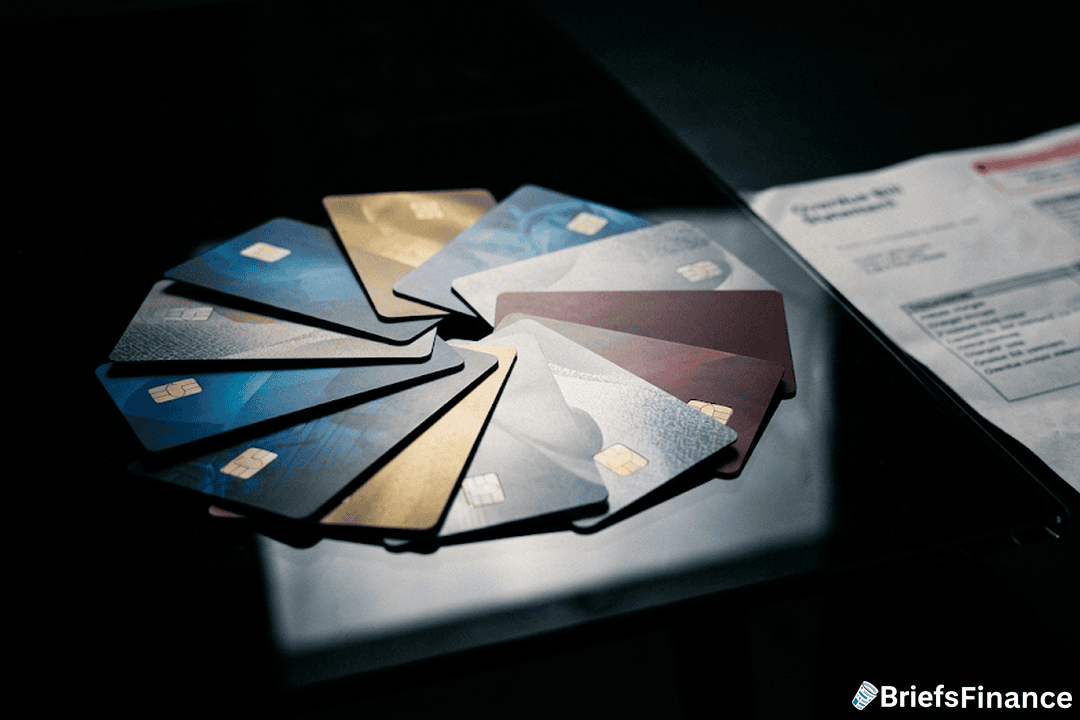
Credit card debt keeps climbing. The Federal Reserve Bank of New York said Tuesday that total card balances hit $1.26 trillion in the second quarter.

That was $21 billion more than people owed in the first three months of the year, and it works out to a 1.7% rise. The new total lands just below the previous year's record of $1.28 trillion.

Late Payments Are Climbing Sharply

The bigger issue isn't just how much people owe. It's how many are falling behind.

The share of card balances more than 90 days overdue hit 12.8% in the second quarter. That was up from 7.6% and prompted concerns about payment defaults not seen since the Great Recession.

Newly late accounts, known as fresh delinquencies, stayed roughly unchanged but remain high. The Fed said 6.97% of card balances moved into delinquency over the past year.

Get the free Always Be Buying eBook and learn the simple system for building wealth on any income

That 90-day figure comes with one catch. Researchers say it is a lagging indicator, because it reflects charge-offs, or debts lenders have already written off, that are still showing up on credit reports.

The researchers also say fresh delinquencies "remain at elevated levels, a trend we'll continue to monitor."

The K-Shaped Economy, in Two Lines

The New York Fed uses the phrase "K-shaped" to describe what the data shows. One arm of the shape points up, one points down, and the distance between them keeps growing.

"To us it reflects this K-shaped economy," the researchers said. "There are a lot of households that live paycheck to paycheck."

The Strain on Households

While the headline numbers grab attention, the human impact is severe. According to the New York Fed, the share of card balances 90 days past due has more than doubled from the low seen in 2021. This pattern mirrors the lead-up to the 2008 financial crisis, though the current environment differs in that job growth remains solid. Still, for many families, the combination of higher food and housing costs and static wages means credit cards have become a stopgap for covering daily expenses.

Economists note that the rise in 90-day delinquencies often precedes a broader slowdown in consumer spending. Because credit card debt carries high interest rates, typically above 20%, households that miss payments face snowballing balances. This can lead to reduced discretionary purchases, which in turn affects corporate earnings and employment. The New York Fed's data also shows that while overall debt levels are near records, the distribution of that debt has become increasingly skewed toward lower-income borrowers, who are more vulnerable to inflation and rising rates.

The Payoff Is Stretching Into a Long-Term Bill

During a Tuesday press call, the New York Fed's research team attributed the climbing delinquency rates to the pressure households face in keeping up with monthly payments.

The bottom line: This is what "K-shaped" feels like on a monthly statement. One group uses cards as a convenience and pays them off, while another uses them just to cover the basics and watches the interest pile up.

For anyone carrying a balance, compounding interest works against you just as hard as it works for your portfolio over time. For investors, it is a reminder that consumer stress can build quietly before it shows up in spending and earnings.

Download the free Always Be Buying eBook and start putting your money to work today
Disclosure

Recent News

1 2 3 53

Get Market Briefs delivered to your inbox every morning for free!

No fluff. No noise. No politics. Just finance news you can read in 5 minutes.

Blogs

June 29, 2026
Portfolio Diversification: Why Putting All Your Eggs in One Basket Destroys Wealth
  • Real diversification means spreading investments across all 11 economic sectors plus bonds, alternatives, and cash so no single bet can sink the portfolio.
  • Different sectors perform at different times, so a diversified portfolio captures upswings while smoothing the brutal drawdowns that wipe out concentrated bets.
  • Total market index funds offer the simplest path to diversification, and annual rebalancing is what keeps the structure working over time.
Read More
June 29, 2026
Non Taxable Income: What It Is and Why It Matters
  • Non taxable income is money you receive that you don't owe income tax on.
  • The tax code treats workers, investors, and business owners very differently, and investors often come out ahead.
  • Learning how income is taxed is a quiet superpower for keeping more of what you earn.
Read More
June 29, 2026
Semiconductor Stocks: A Simple Guide for Investors
  • Semiconductor stocks are companies that design and make computer chips, the brains inside nearly every modern device.
  • The AI boom has turned chips into one of the market's most important and most watched groups.
  • They offer big growth potential, but come with high valuations and a notoriously cyclical history.
Read More
June 25, 2026
How Stocks Work: A Simple Guide for Beginners
  • A stock is a slice of ownership in a company - buy one, and you own a piece of the business.
  • You make money two ways: the share price rising over time, and dividends paid to shareholders.
  • The simplest path for most beginners is buying into the whole market through a low-cost index fund.
Read More
June 25, 2026
Stop Loss vs Stop Limit: What's the Difference?
  • A stop loss order sells your stock once it hits a trigger price, prioritizing getting you out.
  • A stop limit order only sells within a price range you set, prioritizing price over a guaranteed exit.
  • The trade-off: a stop loss almost always executes; a stop limit might not if the price moves too fast.
Read More
June 25, 2026
Energy Stocks: A Simple Guide for Investors
  • Energy stocks are companies that produce and supply the power the world runs on, from oil and gas to newer sources.
  • They make up one of the 11 sectors of the market and tend to move with energy prices and big-picture shifts.
  • Like any sector, the key is diversification and understanding the forces driving demand.
Read More
June 18, 2026
What Is a Stop Loss Order? A Simple Guide
  • A stop loss order automatically sells a stock once it falls to a price you set.
  • It's a tool to cap losses or lock in gains without watching the market all day.
  • It works best for active strategies, and can backfire if used carelessly on long-term holdings.
Read More
June 18, 2026
Best S&P 500 Index Fund: How to Choose One
  • The best S&P 500 index fund for most investors is simply the cheapest, most established one that tracks the index well.
  • Funds like VOO, IVV, and SPY all hold the same 500 companies, so the biggest difference is the fee.
  • Pick one, automate your buys, and let time do the heavy lifting.
Read More
June 17, 2026
What Are Penny Stocks? Risks and Rewards Explained
  • Penny stocks are very low-priced shares of very small companies, often trading for just a few dollars or less.
  • They promise huge gains but carry huge risks: low liquidity, high failure rates, and wild price swings.
  • Most investors are better served by quality companies and funds than by chasing cheap shares.
Read More
June 17, 2026
Best Stocks for Beginners With Little Money
  • The best stocks for beginners with little money usually aren't individual stocks at all - they're low-cost index funds.
  • You can start with $100 or less and use small, regular investments to build wealth over time.
  • Focus on diversification and consistency, not on picking the next big winner.
Read More
1 2 3 24
Share via
Copy link