Free NewsletterPro Login
Free Live Investors Workshop
Seats limited
Tue, Sep 29.
The dollar is losing value.
Here’s how investors can still profit.
Hosted By
Jaspreet Singh
Founder, Briefs Finance
X

Warning: Undefined variable $stocks in /var/www/briefs.co/htdocs/wp-content/plugins/oxygen/component-framework/components/classes/code-block.class.php(133) : eval()'d code on line 448

Warning: foreach() argument must be of type array|object, null given in /var/www/briefs.co/htdocs/wp-content/plugins/oxygen/component-framework/components/classes/code-block.class.php(133) : eval()'d code on line 448

Warning: Undefined variable $funds in /var/www/briefs.co/htdocs/wp-content/plugins/oxygen/component-framework/components/classes/code-block.class.php(133) : eval()'d code on line 472

Warning: foreach() argument must be of type array|object, null given in /var/www/briefs.co/htdocs/wp-content/plugins/oxygen/component-framework/components/classes/code-block.class.php(133) : eval()'d code on line 472
/* the link was here */

What the 1970s Really Taught Investors About Inflation

Published Sep 26, 2026
Share:
Summary:
  • Inflation in the 1970s squeezed stock valuations and profits at the same time, leaving equity returns unusually weak for years.
  • Long Treasuries were hammered as yields climbed, while gold and broad commodities surged once gold pricing was set free in 1971.
  • The era helped cement commodity allocations and led to inflation-indexed Treasuries in 1997, with TIPS outstanding now around $2 trillion.

The surprise: stocks did not behave like built-in inflation hedges

For years, the common take was that stocks shield you from inflation because businesses own real assets and can lift prices when costs jump. The 1970s threw cold water on that, at least over shorter and mid-length horizons. Two hits landed at once.

  • Valuation pressure: As inflation rose, borrowing costs in nominal terms climbed, lifting the discount rate applied to future earnings.
  • Profit squeeze: Many companies could not immediately pass pricier energy and raw materials through to customers. Real earnings fell, which piled on top of the multiple hit.

The outcome was an unusually weak stretch for equities that later fed into the conversation about the equity premium puzzle. The dry spell was long too. Someone who bought the S&P 500 at the 1966 peak did not get back to even in nominal dollars until about 1982, roughly sixteen years later.

After factoring in about 150 percent cumulative inflation over that window, the real drawdown was about 60 to 65 percent. On an inflation-adjusted basis, the S&P 500 did not revisit its 1966 high until around 1992, about twenty-six years after the starting point.

Bonds were the real wreckage

Long-duration government bonds delivered the worst major-asset performance in the inflationary 1970s. The math was brutal as yields kept climbing. A 30-year Treasury issued in 1965 with a 4.5 percent coupon had around $88 of market value per $100 face by 1970 when yields were near 6 percent.

By 1975, as yields approached 8 to 9 percent, that value slid to roughly $55 to $60. When yields peaked around 15 to 16 percent in 1981, it traded near $30 to $35.

Someone purchasing 30-year Treasuries in 1965 would, by 1981, be down roughly 65 to 70 percent on principal in nominal terms and about 85 to 90 percent in real purchasing power. Coupons helped but did not come close to making up for the capital damage. The lesson stuck: so-called risk free applies to nominal default, not to inflation or interest rate risk, which can lead to steep real losses.

Gold, commodities, and the assets that kept up

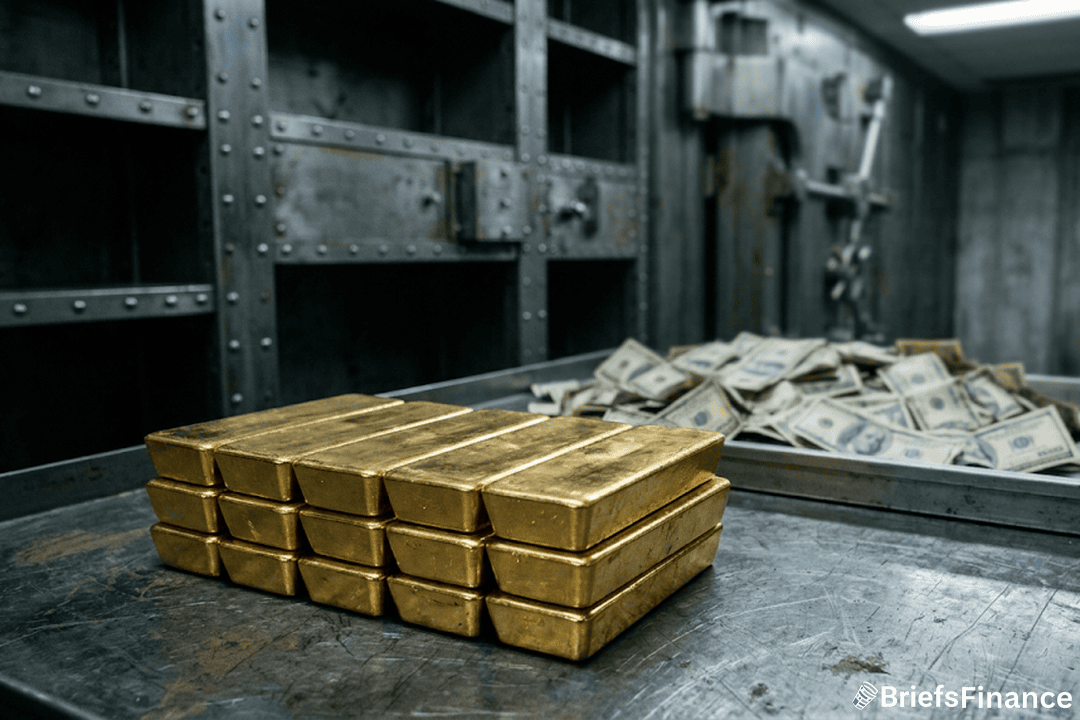
For decades, gold traded at a pegged price - initially $20.67 per ounce during the classical gold standard, and later $35 per ounce under Bretton Woods. That changed when convertibility was suspended in 1971 and the market could set the price. What followed was a dramatic repricing.

Around 1971, gold traded near $35 to $40 per ounce. It climbed to roughly $185 in 1974, dropped to about $100 in 1976, then surged to approximately $850 in January 1980 before settling near $300 to $350 by 1982.

Steady habits and thoughtful diversification help protect and grow your savings over time. Join Briefs Finance CEO Jaspreet Singh on September 29th for a FREE live investor workshop, How to Profit From A Dollar That's Losing its Value, where he shows how we're spotting investment opportunities as the dollar falls. Save your spot.

From the 1971 shift to the 1980 peak, the move worked out to roughly a 2,100 percent nominal gain and about 600 percent in real terms. The metal also posted standout returns from the 1973 embargo to that 1980 high. Why the strength? Three forces dominated:

  • A monetary system reset: once the dollar link broke, gold could reflect prior money supply growth that had accumulated while the price was fixed.
  • Inflation protection: as paper currencies lost purchasing power during a credibility crisis, gold's role as a store of value drove demand.
  • Safe haven buying: geopolitical and financial stress, including the Vietnam War aftermath, Watergate, and the Iranian hostage crisis, pushed investors toward perceived safety.

Commodities more broadly moved with inflation. Crude climbed from about $3 a barrel at the start of 1973 to near $35 by 1980, a nominal jump of more than 1,000 percent. Copper, silver, agricultural markets, and energy generally followed that pattern.

Energy producers such as Exxon, Texaco, and Gulf Oil saw returns that beat the broad market and delivered positive real outcomes when the S&P 500 did not. The experience prompted institutional investors/) - including sovereign wealth funds alongside pension funds and endowments - to carve out specific commodity sleeves to guard against inflation.

Real estate held up, and the policy toolkit changed

Housing largely kept pace with inflation through the decade, and fixed-rate mortgages turned into a tailwind as rising prices eroded the real value of outstanding debt. Commercial property results varied by sector. Leverage mattered even more in that era: carrying a 30-year loan at a fixed 7 percent meant that when inflation ran at 10 to 12 percent, the inflation tax shrank the debt in real terms, while nominal home values often matched or exceeded the price surge.

The long bond slump spurred a structural response. Inflation-indexed bonds were created to secure real returns regardless of the inflation path. TIPS combine government credit quality with inflation adjustment so that investors earn the real yield rather than hoping actual inflation lands below what was baked into a conventional bond's price at purchase. The TIPS market today has about $2 trillion outstanding.

How the 1970s still shapes portfolios

A few principles stuck. Many institutions maintain dedicated allocations to inflation-sensitive assets such as commodities, TIPS, real estate, and infrastructure to guard against inflationary regimes. Fixed income managers pay close attention to duration because long bonds carry significant inflation risk, and liability-driven investors often trim duration when those risks rise. Finally, the decade reinforced commodities as a distinct return source with drivers that differ from stocks and bonds.

The upshot for your money: inflation can reshuffle which assets do the heavy lifting. When prices run hot, cash flows and valuations react at different speeds. Owning a mix that can handle more than one economic script gives you a better shot at keeping your purchasing power intact.

Learning practical strategies can keep your financial goals on track through uncertainty. Our CEO Jaspreet Singh is hosting a FREE live investor workshop, How to Profit From A Dollar That's Losing its Value, on September 29th. Sign up free to join him live.


Disclosure

Recent News

1 2 3 … 86

Get Market Briefs delivered to your inbox every morning for free!

No fluff. No noise. No politics. Just finance news you can read in 5 minutes.

Blogs

September 25, 2026
BRIEFS EXCLUSIVE: 43% Of Respondents Say Bills Outran Their Income Over Past Two Years
  • 43% of the 494 Market Briefs readers surveyed said their bills grew faster than their income over the past two years, even though 79% could cover a surprise $5,000 expense tomorrow.
  • Half of readers own gold or crypto, the two classic bets against a weaker dollar, and only 13% bought nothing at all in the last 12 months.
  • The median reader says it takes $150,000 a year to feel financially secure, about $62,000 above the U.S. median household income.
Read More
September 25, 2026
The Economy Is Booming. So Why Did Stocks and Bonds Fall Together?
  • S&P Global says the US economy is growing at its fastest rate since 2021, with corporate profits up 28.9% in a year, almost four times the historical average.
  • Stocks and bonds fell at the same time, which is not how the two markets normally behave, because Treasury yields above 5% now compete with stocks for investors' money.
  • Jaspreet Singh lays out three ways to invest through a shift like this: always be buying, buy the crash, or follow the money before it hits the headlines.
Read More
September 24, 2026
The 2026 Economic Reset Is Starting: Are We in a Recession, or Is the Pain Still Ahead?
  • The Federal Reserve has flipped from stimulating the economy to fighting inflation with higher interest rates, while the White House still wants growth at almost any cost.
  • The national debt tops $40 trillion, has outgrown the entire U.S. economy, and its interest payments are now the government's fastest-growing expense.
  • Higher rates bring pain for private equity, private credit, and speculative assets, but they open opportunities for investors holding cash, treasuries, and value assets.
Read More
September 23, 2026
Are We in a Recession? Without AI, America Might Already Be in One - and Washington Knows It
  • The White House attributes about three quarters of U.S. economic growth to AI, and many believe the economy would already be in a recession without it.
  • Washington has three reasons it cannot let the AI boom slow down: staying the world's superpower, outgrowing $40 trillion in national debt, and protecting a government stock portfolio worth billions.
  • Every market goes through booms and busts, and investors who understand the cycle get to buy the downturn instead of panic-selling with the crowd.
Read More
September 22, 2026
Will Interest Rates Go Down in 2026? Where the Money Moves Either Way
  • The Fed is leaning toward higher rates to fight 4% inflation, while the White House and a cracking job market push the other way.
  • If rates rise, money has tended to move toward short-term Treasuries, floating-rate loans, energy, banks and dividend payers.
  • If rates fall, it has tended to move toward gold, silver and Bitcoin, real estate, small caps, the S&P 500 and speculative bets.
Read More
September 21, 2026
How the Federal Reserve Makes Money - and Why It Just Posted Its Biggest Loss Ever
  • For 109 years the Federal Reserve created money, lent it to the U.S. government and handed the interest it collected back to Washington - almost $1 trillion in the decade starting in 2011.
  • Pandemic-era lending locked the Fed into earning about 2% on trillions of dollars while it now pays banks around 4%, producing a record loss of hundreds of billions in 2026.
  • The Fed covers its losses by creating money and the government covers its lost revenue by borrowing, and both feed the inflation that eats at the dollars in your account.
Read More
September 18, 2026
Kevin Warsh Just Defied Trump: What the Fed Rate Hike Means for Your Money
  • The Fed raised rates for the first time since 2023 in a unanimous vote led by Kevin Warsh, the chairman President Trump appointed to cut them.
  • Higher rates make the $40 trillion national debt, business loan resets and mortgages more expensive, but they strengthen the dollar and pay investors holding cash.
  • The war with Iran is pushing up oil, grocery and chip prices, another hike is likely in 2026, and recession talk is about to get louder.
Read More
September 17, 2026
Why America Bailed Out the Yen: The Japan Carry Trade, the Dollar and Your Mortgage Rate
  • In July 2026 the US sent money to steady the yen because Japan is the largest foreign owner of US debt, and Washington needs Japan to keep lending.
  • For decades the Japan carry trade let Wall Street borrow yen at essentially 0% and pour it into US stocks, real estate and Treasuries, and rising Japanese rates are shutting that off.
  • A weaker yen means fewer buyers for the dollar and for US debt, which pushes Treasury rates up and drags mortgage, car loan and credit card rates up with them.
Read More
September 16, 2026
Treasury Yields Are Spiking Because Lenders Are Backing Away From U.S. Debt
  • The U.S. is paying its highest 30-year borrowing rate in about two decades because its biggest lenders, the Fed, foreign governments, and banks, are all pulling back from Treasuries.
  • Every mortgage, car loan, credit card, and business loan is priced off the 10-year Treasury yield, so when Washington pays more to borrow, so do you.
  • With about $40 trillion of debt against a $32 trillion economy, the country either outgrows its debt or slides into a doom loop, and investors need a plan for both.
Read More
September 15, 2026
Fiat Currency Runs on Trust, and the World Just Stopped Trusting the Dollar
  • Gold has overtaken US treasuries as the world's top reserve asset, and central banks are now buying less US debt and more gold.
  • The US dollar is a fiat currency, meaning it's backed by a promise rather than gold, so it loses value when fewer countries want to hold it.
  • Whether the US economy or its national debt grows faster from here decides which assets stand to benefit next.
Read More
1 2 3 … 27
Share via
Copy link