Pro Login

The Inflation Headline Was Scary. The Actual Data, Not So Much.

A stylized illustration of a cylindrical cup with blue arrows and lines indicating a swirling or rotational motion inside the cup.
Briefs Finance
Published Mar 2, 2026
Share:
A crumpled newspaper with an inflation headline casts a dinosaur-shaped shadow beside financial reports, a calculator, and an upward arrow, symbolizing market fears.
Summary:

    • January's Producer Price Index came in "hotter than expected" — but the details tell a calmer story.

    • Goods prices actually fell in January; the spike came from a single volatile category in services.

    • Core inflation — the number the Fed actually watches — came in exactly as expected.

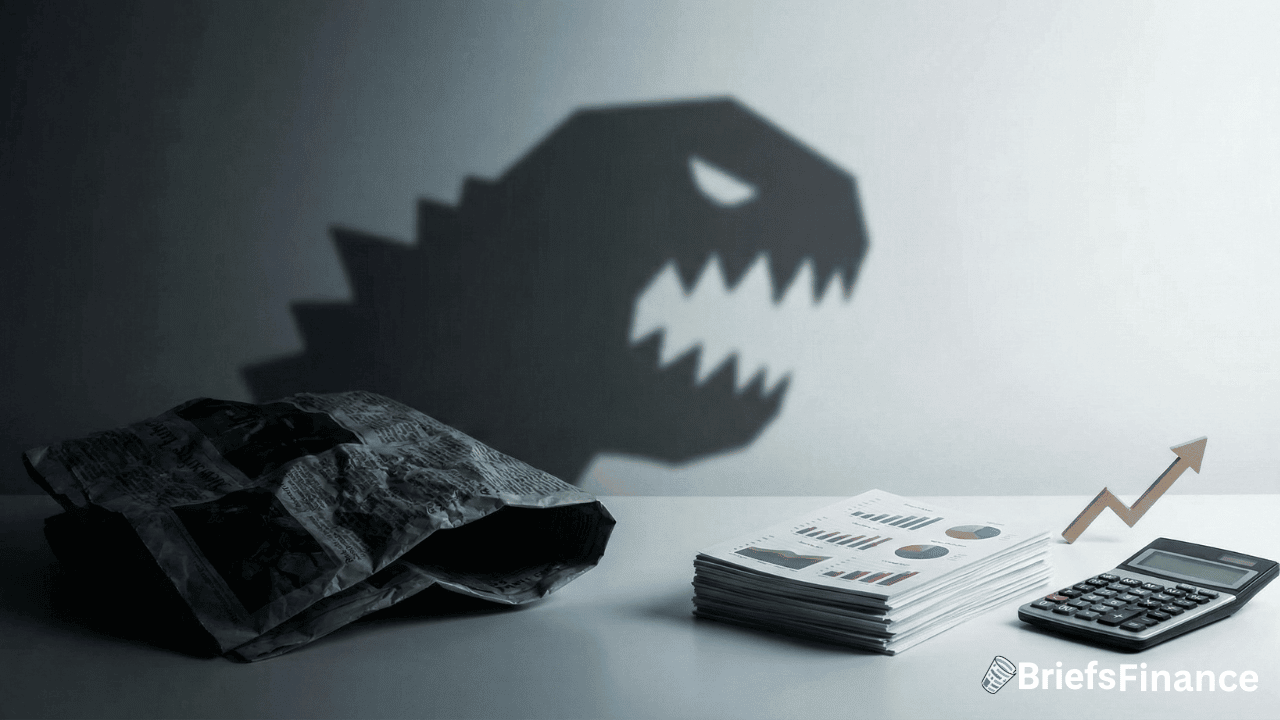
Every few weeks, an inflation report drops and the headlines scream. This week it was the PPI. Here's what the number actually said.

What Happened

The Producer Price Index — which tracks what businesses pay before those costs reach consumers — rose 0.5% in January. Analysts expected 0.3%. Cue the alarm bells.

But zoom out for a second. Producer prices are up 2.9% over the past year. That sounds high until you remember they were rising at a 3.8% pace in January 2025. Inflation at the producer level is actually cooler than it was a year ago.

The "hot" headline and the underlying data are telling two very different stories.

Where the Spike Actually Came From

Here's the part the headlines skipped: goods prices fell 0.3% in January. Energy dropped 2.7%. Food fell 1.5%. Those aren't the numbers of an overheating economy.

The jump came entirely from services — specifically a category called "trade services margins," which surged 2.5% in January after rising 1.8% in December. That sounds alarming until you understand what it actually measures.

Trade services margins track the markup that wholesalers and retailers charge — the spread between what they pay for goods and what they sell them for. When that number pops, it usually reflects short-term pricing adjustments or businesses rebuilding profit margins. It doesn't mean raw materials are getting more expensive.

Peter Navarro, writing for RealClearMarkets, put it plainly: this was "a services-side markup adjustment, not evidence of a new supply-chain inflation shock."

What This Means for Your Portfolio

The number Wall Street watches most closely is core PPI — which strips out food, energy, and the volatile trade services category. That came in at exactly 0.3%, right in line with expectations. On a 12-month basis, core PPI sits at 3.4%, slightly below where it was a year ago.

That's not acceleration. That's stability.

The takeaway for investors: one hot headline print doesn't change the trend. Goods prices are falling, core inflation is steady, and the categories driving the spike tend to reverse within a quarter or two. The Fed is watching the same data you are — and what they're seeing doesn't point to a new inflation surge.

Markets may stay nervous. The data says keep calm.

Disclosure

Get Market Briefs delivered to your inbox every morning for free!

Market briefs opt-in (#63)
No fluff. No noise. No politics. Just finance news you can read in 5 minutes.

Blogs

April 9, 2026
What Is a Meme Stock? A Simple Guide for New Investors

You've probably heard the term "meme stock" thrown around on […]

Read More
April 9, 2026
Enterprise Value Formula: What It Is and How to Calculate It
  • Enterprise value (EV) shows what a company is really worth - debt and cash included - not just its stock price
  • The enterprise value formula is: Market Cap + Total Debt - Cash and Cash Equivalents
  • Investors use EV with metrics like EBITDA to compare stocks more fairly than market cap alone
Read More
April 8, 2026
Return on Equity: What It Is and How to Use It
  • Return on equity (ROE) measures how much profit a company earns for every dollar of shareholder equity
  • The formula is simple: net income divided by shareholder equity
  • A higher ROE can signal a company that is good at turning investor money into profit - but it is not the full picture
Read More
April 4, 2026
Personal Finance Books That Actually Teach You to Build Wealth

Most investors grow up hearing the same financial advice. Study […]

Read More
April 4, 2026
How to Reduce Taxable Income: 6 Strategies Investors Actually Use

The tax code in the United States is over 2,000 […]

Read More
April 4, 2026
What Is a High-Yield Savings Account - and Is It Worth It?

Most banks pay you almost nothing to hold your money. […]

Read More
April 3, 2026
Best Stocks to Buy Now: A Smarter Way to Think About It

Most investors start their journey the same way. They Google […]

Read More
April 3, 2026
How to Avoid Capital Gains Tax: 7 Legal Strategies Every Investor Should Know

Warren Buffett earned $704 million in dividends in 2021. His […]

Read More
April 3, 2026
How to Read a Balance Sheet (And Why Every Investor Should Know How)

You wouldn't buy a house without looking at the inspection […]

Read More
April 3, 2026
What Is a Stock Broker? A Simple Guide for New Investors

You've decided you want to start investing. You open your […]

Read More
1 2 3 16
Share via
Copy link