When a famous investor like Bill Ackman takes a 20% stake in a company, the stock often jumps. We saw it with Hertz - the share price spiked the day Ackman's hedge fund Pershing Square Capital announced its position. The stock had been struggling for years, and a 20% buy from a major investor flipped sentiment overnight.
How do regular investors find out about these moves? Through a quarterly filing called a 13F.
Tracking institutional money is one way to spot market shifts. Reading the daily news is another. That's what we cover at Market Briefs - our free daily newsletter that breaks down the biggest stock stories every morning. Subscribe free here.
What Is a 13F Filing in Plain English
A 13F is a quarterly report that big institutional investors file with the SEC. We're talking about hedge funds, mutual funds, pension funds, and other large money managers.
The filing lists their stock holdings at the end of each quarter. It shows what they own, how many shares, and how things changed since the last quarter. It's filed every three months, and it's public.
So why does this matter? Tracking institutional money is one of the five Market Shifts we teach at Briefs Pro. We call it the Wall Street Shift - when major institutions move money, it can signal where confidence (or fear) is heading. By watching where the smart money flows, you get a window into how the biggest investors in the world are positioning their portfolios.
Why 13F Filings Matter for Investors
When hedge funds reshuffle their holdings, it tells you something. They have teams of analysts and millions of dollars of research. They aren't always right, but they don't move randomly either.
Following 13Fs is like watching where the smartest investors are placing their bets. It's not a copy-paste strategy, because there are real limits we'll cover in a minute. But it can tip you off to a name worth researching - and worth running through a proper valuation process.
A few examples of what 13F watchers track:
Berkshire Hathaway's holdings. Warren Buffett's company files a 13F every quarter. Investors all over the world wait to see what Buffett bought or sold. When his team built up massive cash reserves heading into 2025 - because they expected market volatility - that move was visible across the filings. Buffett's positions in Apple, Bank of America, Coca-Cola, and American Express are all tracked publicly. (Buffett is also the king of value investing.) Pershing Square Capital. Bill Ackman's fund became famous after big positions in Hertz and other turnaround plays. When Ackman buys, retail investors often follow. Other big funds. Bridgewater, Renaissance Technologies, Tiger Global, and dozens of others all file 13Fs. Each one represents billions of dollars of institutional positioning.
When multiple big funds buy the same stock in the same quarter, that's worth a closer look.
How to Find a 13F Filing on SEC EDGAR
Every 13F lives on SEC EDGAR, the same free database that has 10-Ks, 10-Qs, prospectuses, and every other public filing.
Search the fund's name. Try "Berkshire Hathaway" or "Pershing Square Capital Management." You can also search by the manager's individual name in some cases.
Filter by 13F-HR, which is the standard form type. You can pull the latest filing or compare it to past quarters.
The filing itself shows each stock the fund owns, the number of shares, and the dollar value at the end of the quarter. You can spot new positions, full exits, and big increases or decreases.
Several websites also aggregate 13F data into searchable tables. The raw filing on EDGAR is the source, but third-party tools can make comparisons easier across multiple funds.
How to Read a 13F Filing
The structure of a 13F is pretty simple. Each row is a stock position. The columns include the company name, ticker, number of shares, dollar value at the end of the quarter, and an indicator showing if the position is new, increased, decreased, or unchanged. (For a refresher on what tickers, shares, and other terms mean, our 77+ stock market terms guide is a quick reference.)
Look for four things when you pull up a filing:
New Positions
A "new" position means the fund didn't hold the stock last quarter and just bought into it. New positions can signal that the fund has identified a fresh opportunity.
Increased Stakes
If a fund already owned a stock and bought more, that's a vote of confidence. The bigger the increase, the stronger the signal.
Reduced or Closed Positions
Funds also sell. If a major holding gets cut by 50% or closed entirely, that can signal a change in thesis. Sometimes funds sell for portfolio reasons (like rebalancing), but a wave of selling on the same name across multiple funds is worth attention. (Knowing when to sell a stock is just as important for retail investors.)
Top Holdings by Size
The biggest positions in any 13F show what the fund has highest conviction in. These are the bets they're putting the most money behind.
How to Use 13F Data Without Getting Burned
Don't just copy what a hedge fund bought. The filing has real limits.
The biggest one is timing. A 13F is filed up to 45 days after the quarter ends. So by the time you see it, the data is potentially three to six weeks old. The fund could have already sold by then. The stock price has likely moved.
A 13F also doesn't include short positions, cash holdings, bonds, or many derivatives. So you only see part of the picture. A fund might be long on one stock and short on three others, but the 13F only shows the long side.
Use 13F data as a research starting point, not a conclusion. If three big funds added the same stock last quarter, that's a lead worth investigating. Then run the company through your own analysis - business model, CEO, moat, balance sheet, the works. Use it alongside how to evaluate a company's financial health for a complete view.
13F Filings and the Wall Street Shift
In our Zero to Pro program, we teach that Wall Street Shifts happen when institutions move capital in a coordinated way. 13F filings are one of the best ways to spot these shifts. (We covered all five in our breakdown of the 5 market shifts that will define investing in 2026.)
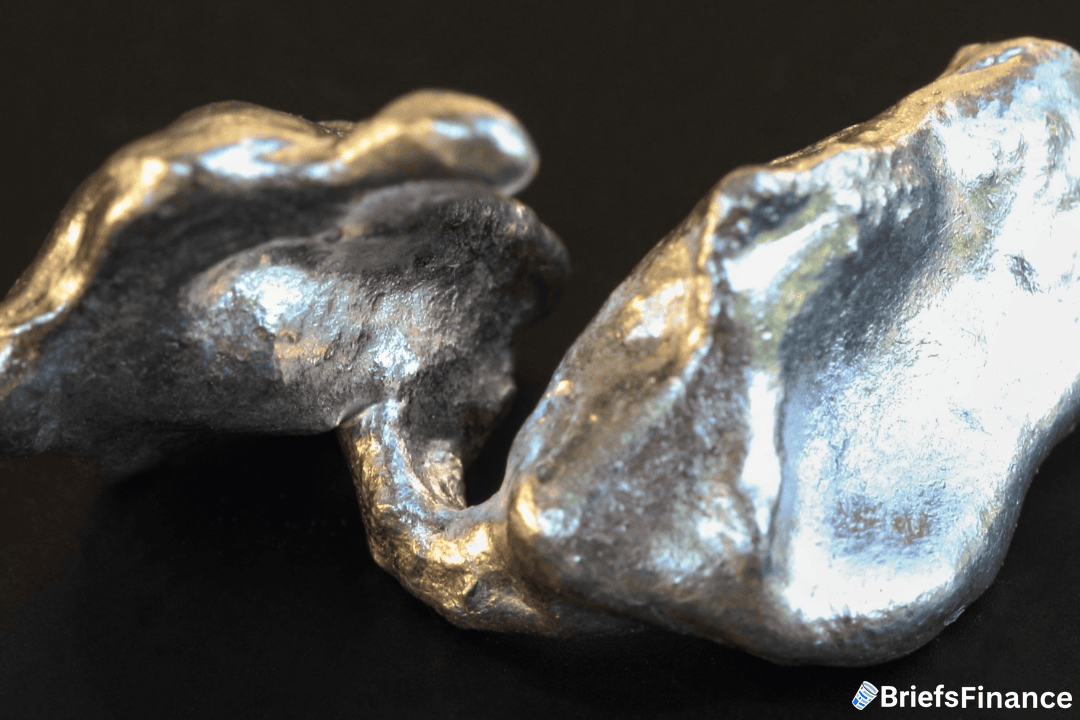
For example, if you noticed that multiple big funds added gold mining stocks in the same quarter, that's a signal worth tracking. Combined with rising gold prices and a falling dollar, it could be the early sign of a real Wall Street Shift toward precious metals.
We saw something like this in 2025. The U.S. dollar fell more than 10% in the first half of the year - its worst performance in over 50 years. Institutions started buying gold and gold miners aggressively. Looking at 13F filings during that period, you could see the rotation happening in real time.
A Word of Caution on Following 13F Filings
A few things to keep in mind:
Funds sometimes file early, late, or with different cutoffs. The data can be messy. Big funds also have different goals than retail investors. A pension fund might hold a stock for the dividend, while a hedge fund might be holding it as part of a complex options strategy.
The point is to use 13Fs as one input among many, not as financial advice. Don't bet your savings on a single fund's pick. Use the data to find ideas, then do your own work - including running each idea through proper active investing analysis.
Try Reading a 13F Today
Pull up Berkshire Hathaway's most recent 13F on EDGAR. Compare it to last quarter's. Pick one stock that's new or where holdings grew significantly, then run that company through the four-step non-financial analysis.
You'll start to see patterns. You'll spot when smart money is rotating into new sectors. You'll catch shifts before they become mainstream - including the kind of moves smart money makes in the best stocks to buy lists that come out each year.
Following smart money is a long game. To stay current with the news that moves stocks every day, subscribe to Market Briefs - our free daily newsletter delivered every morning.