What Does Financial Health Really Mean?
Before you invest a single dollar, you need to answer one question: Is this company healthy?
A company might look successful on the surface, especially if it’s a big name.
But appearances lie.
Flashback: Remember Enron?
The energy company looked fine on the surface. Its shares even hit a record high in 2000, before collapsing a year later.
But on paper - Enron was falling apart. And beyond that, its business was a disaster, and the only investors who knew were the ones that looked.
Or Blockbuster? They had stores everywhere.
Then Netflix came along - Blockbuster failed to innovate and went bankrupt.
Financial health means doing two things:
- Analyzing a company's financial health (financial analysis).
- Analyzing a company's business (non-financial analysis).
You need both. Numbers without business context miss critical problems. Business analysis without numbers misses financial disasters.
Today, we’re breaking down how to evaluate a company’s financials - showing what you want to look for, where to look, and what to do with the info once you’ve found it.
Speaking of which - our market analysts are evaluating companies every day and showing you which companies may potentially beat the market.
If you want to read about these potential investing opportunities every week, subscribe to Market Briefs Pro.
Part 1: Financial Analysis - Reading the Numbers
Financial analysis means digging into a company's financial statements. These documents show you the real story behind the business.
Where to Find Financial Statements
Every public company must file financial reports with the SEC (Securities and Exchange Commission). These reports contain all the financial data you need.
Two ways to find financial reports:
Method 1: SEC EDGAR Database
- Go to sec.gov.
- Click "Search Filings".
- Type the company name or stock ticker.
- Look for 10-K (annual) or 10-Q (quarterly) reports.
Method 2: Company Investor Relations Page
- Go to the company's website.
- Scroll to find "Investor Relations".
- Look for financial reports and SEC filings.
Most of the financial info you need to evaluate a company’s financial health is found in a company's 10-K or 10-Q.
What's the difference between 10-K and 10-Q?
| Report Type | 10-K | 10-Q |
| Frequency | Annual | Quarterly |
| Audit Status | Audited | Unaudited |
| Time Frame | Full fiscal year | 3 months |
| Detail Level | Very comprehensive | Shorter snapshot |
| When to Use | Long-term analysis | Recent updates |
How do you know which report to use?10-Ks are better for deep analysis, because they offer a more comprehensive view of a company’s financials.
That’s because they give you 365 days of financial info.
10-Qs offer a shorter time frame. A company may look solid for one quarter, but in trouble the next.
Both give you a look into a company’s financial health - and choosing which one to look at depends on what you’re looking for.
The Three Financial Statements You Must Know
Every 10-K contains three critical financial statements. Master these and you'll understand any company's financial health.
1. The Balance Sheet
The balance sheet shows what a company owns and what it owes.
It’s similar to your net worth statement. It lists:
- Assets: Everything the company owns.
- Liabilities: Everything the company owes.
- Shareholder Equity: What's left for owners after paying debts.
The golden rule: Assets = Liabilities + Shareholder Equity
This equation must always balance. That's why it's called a balance sheet.
Real Example: Coca-Cola's Balance Sheet
Let's look at actual numbers from Coca-Cola's 10-K.
Note: All numbers are from Coca-Cola’s 10-K for the 2024 fiscal year.
Assets:
- Current assets: $35 billion (cash, inventory, accounts receivable).
- Non-current assets: $65 billion (property, equipment, long-term investments).
- Total Assets: $100 billion.
Liabilities:
- Current liabilities: $30 billion (bills due within 12 months).
- Non-current liabilities: $44 billion (long-term debt).
- Total Liabilities: $74 billion.
Shareholder Equity: $26 billion
Notice: $100 billion (assets) = $74 billion (liabilities) + $26 billion (equity).
The balance sheet balances.
What This Tells You
Current vs. Non-Current Assets
- Current assets can become cash within 12 months.
- Non-current assets take longer to liquidate.
Current vs. Non-Current Liabilities
- Current liabilities are due within 12 months.
- Non-current liabilities are due later.
Shareholder Equity
- This is the company's book value.
- What shareholders would get if the company liquidated everything.
2. The Income Statement
The income statement shows if a company is making money or losing money.
It's like your paycheck stub. It shows:
- Revenue: Total money coming in.
- Expenses: Total money going out.
- Net Income: Profit after all expenses.
Real Example: Coca-Cola's Income Statement
Note: All numbers are from Coca-Cola’s 10-K for the 2024 fiscal year.
Revenue:
- Net operating revenues: $47 billion
Expenses:
- Cost of goods sold: $18 billion.
- Operating expenses: $12 billion.
- Interest and taxes: $7 billion.
- Total Expenses: $37 billion.
Net Income: $10.6 billion
Coca-Cola made $10.6 billion in profit that year.
What The Income Statement Tells You
Growing Revenue = Company is selling more.
Shrinking Revenue = Company is selling less.
Growing Net Income = Company is getting more profitable.
Shrinking Net Income = Company is getting less profitable.
Red Flag: Revenue growing but net income shrinking means costs are rising faster than sales.
3. The Cash Flow Statement
The cash flow statement shows how money moves through the company.
A company can be profitable on paper but run out of cash. The cash flow statement reveals where money is going.
It has three sections:
Operating Cash Flow: Cash from running the business.
Investing Cash Flow: Cash spent on growth (equipment, acquisitions).
Financing Cash Flow: Cash from debt or shareholders.
Real Example: Coca-Cola's Cash Flow
Note: All numbers are from Coca-Cola’s 10-K for the 2024 fiscal year.
Operating Activities:
- Cash from operations: $12 billion.
Investing Activities:
- Cash spent on equipment: -$2 billion.
- Cash from selling assets: +$500 million.
- Net Investing: -$1.5 billion.
Financing Activities:
- Cash from issuing debt: +$5 billion.
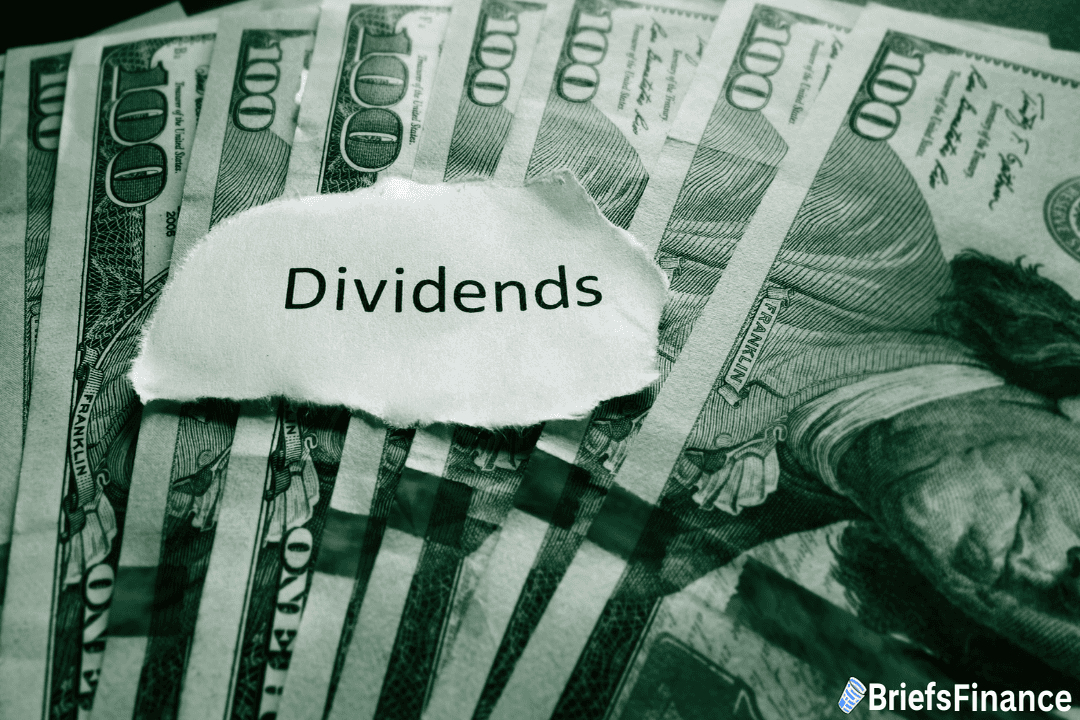
- Cash paid to shareholders (dividends): -$8 billion.
- Net Financing: -$3 billion.
Change in Cash:
Start: $10 billion
Operations: +$12 billion.
Investing: -$1.5 billion.
Financing: -$3 billion.
Ending Cash: $17.5 billion
What This Tells You
Positive Operating Cash Flow = Business generates cash.
Negative Operating Cash Flow = Business burns cash.
Negative Investing Cash Flow = Company is investing in growth.
Positive Investing Cash Flow = Company is selling assets.
Companies need cash to survive and they need money in order to grow.
Profitable companies have gone bankrupt because they ran out of cash.
Key Financial Ratios to Calculate
Now that you have the numbers, the real work begins
Now you are able to take these numbers and begin valuing the company’s financials.
Quick Ratio Check: Is the Company Profitable?
Look at the income statement bottom line. Compare this number to the previous year.
Is net income positive or negative?
Positive net income = Profitable.
Negative net income = Losing money.
Debt Check: How Much Does the Company Owe?
Compare total liabilities to total assets on the balance sheet.
Example: Coca-Cola
Note: All numbers are from Coca-Cola’s 10-K for the 2024 fiscal year.
- Total Assets: $100 billion.
- Total Liabilities: $74 billion.
- Debt-to-Asset Ratio: 74%.
This means 74% of Coca-Cola's assets are funded by debt. The remaining 26% is equity.
What does that mean?
- Under 50% = Low debt.
- 50-70% = Moderate debt.
- Over 70% = High debt (could be risky).
But this varies by industry. Banks naturally have high debt. Tech companies often have low debt.
Growth Check: Is the Company Growing?
Compare this year's revenue to last year's revenue.
Example: Microsoft
Note: All numbers are from Microsoft’s 10-K for the 2024 fiscal year.
- 2023 Revenue: $211 billion
- 2024 Revenue: $245 billion
- Growth Rate: 16%
Microsoft grew revenue by 16% year-over-year. That could be a positive sign that it’s products and services are growing in demand.
What's good?
- 10%+ growth = Strong.
- 5-10% growth = Moderate.
- 0-5% growth = Slow.
- Negative growth = Shrinking (red flag).
Profitability Check: How Efficient Is the Company?
Calculate net profit margin: Net Income ÷ Revenue
Example: Microsoft
Note: All numbers are from Microsoft’s 10-K for the 2024 fiscal year.
- Net Income: $88 billion.
- Revenue: $245 billion.
- Profit Margin: 36%.
Microsoft keeps 36 cents of profit from every dollar of sales. Compare that to other companies in its industry.
What's good?
- 20%+ = Excellent margins.
- 10-20% = Good margins.
- 5-10% = Average margins.
- Under 5% = Thin margins.
How to Spot Financial Red Flags
Many investors simply look at a company's share price to determine value - but price does not = value.
If a company’s shares are trading for $100, is that a good deal, or a bad deal?
Evaluating a company’s financials and non-financials using analysis tells the full story.
Once you have the info, you can determine if the stock makes sense for your portfolio.
But there are some red flags you’ll want to be aware of:
Red Flag 1: Declining Revenue
If revenue is falling quarter after quarter, the business is shrinking.
This could indicate the company is not innovating, or there is slowing demand for its products.
The industry could also be losing steam. Compare to others in the space to see if this is an industry wide problem or one company losing market share.
Red Flag 2: Rising Debt
If total liabilities are growing faster than assets, the company is taking on more debt.
Check the balance sheet from multiple years. Is debt increasing while revenue isn't?
Then go one step further - what is the company spending this debt on?
Debt doesn’t always = problems. But it can signal a business is overleveraged and is trying to survive rather than thrive.
Red Flag 3: Negative Cash Flow
If operating cash flow is negative, the company burns more cash than it generates.
This can't continue forever. The company will eventually run out of money.
Red Flag 4: CEO Turnover
If the CEO was just fired or resigned under pressure, dig deeper.
Leadership instability often signals deeper problems.
Red Flag 5: Desperate Partnerships
If a company is making deals that suggest survival mode (selling valuable divisions, taking on expensive debt), be cautious.
Red Flag 6: Delisting Threats
If the stock price falls below $1 for too long, exchanges threaten to delist it.
This is catastrophic for shareholders and it can be extremely difficult to come back from.
Part 2: Non-Financial Analysis - Evaluating the Business
Numbers alone miss critical context. You also need to evaluate the business itself.
Insider secret: Companies do their best to make sure financial statements look great.
Companies legally can’t lie - but, companies sometimes use accounting tricks to buff up the numbers.
Fundamental non-financial analysis takes a look at everything else a company is doing that can’t be found on paper.
Professional investors use a four-step framework when evaluating a company’s non-financials.
BTW: Our analysts are using this framework every week to outperform markets with unique potential investing opportunities.
Learn more and subscribe to Market Briefs Pro.
Question 1: What's the Business Model?
Understand how the company makes money.
Example: Coca-Cola
- Sells beverages globally.
- Sells syrup and concentrates to bottlers.
- Founded in 1866.
- Iconic American brand.
Example: Amazon
- Started selling books online.
- Expanded to everything.
- Built massive logistics network.
- Created cloud computing business (AWS).
Why this matters: You need to understand the business. Warren Buffett won't invest in companies he doesn't understand.
This helps you understand what makes one company unique over another, how it ultimately makes money, and if it will continue to grow or not.
How to find this:
- Company website "About" section.
- 10-K report (Business section).
- Investor presentations.
Question 2: Who's the CEO?
Leadership matters enormously. Companies with strong CEOs navigate challenges better.
Think Jensen Huang, Elon Musk, Jamie Dimon, Bob Iger - the list goes on. Their leadership has translated into billions of dollars in added market cap for their respective companies.
Example: Coca-Cola CEO James Quincey
- Joined Coca-Cola in 1996.
- Background in consulting (Bain and Kalchas).
- Led expansion into Latin America.
- Known for strategic thinking.
Where to find CEO information:
- Company investor relations page (usually has CEO bio).
- 10-K report (Executive Officers section).
- Google search: "[Company name] CEO".
Red flags:
- Frequent CEO changes.
- CEO with no relevant experience.
- Scandals or legal issues.
- Vague or evasive communication style.
Good signs:
- Long tenure showing stability.
- Clear vision for the company.
- Industry expertise.
- Honest, straightforward communication.
Question 3: Is the Company Innovating?
Companies that stop innovating eventually fail.
Example: Coca-Cola Innovation
- Expanded partnerships (Jack Daniels collaboration).
- Joined MIT AI groups.
- Using AI for personalized advertising.
- Collecting and monetizing consumer data.
- Very tech-forward for a beverage company.
Counter-Example: Blockbuster
- Dominated movie rentals.
- Business model relied on late fees.
- Netflix introduced streaming.
- Blockbuster failed to adapt.
- Filed bankruptcy.
Innovation separates survivors from failures.
How to check innovation:
- Company press releases.
- Recent product launches.
- R&D spending in 10-K.
- Technology partnerships.
- Industry news about the company.
Question 4: What's the Company's Moat?
A moat is a competitive advantage that protects the company from competitors.
Think of a medieval castle. Moats field with water, alligators, and sharks kept invaders out.
The same principle applies today for modern companies. The better the moat, the easier it is for companies to keep and grow their share of the market.
Example: Coca-Cola's Moats
1. Brand Strength
- One of the most recognized brands globally.
- Instantly recognizable logo and bottle.
- Decades of marketing building emotional connections.
2. Distribution Network
- Available in all but 3 countries (North Korea, Cuba, Russia).
- Exclusive partnerships with major restaurants.
- McDonald's, Burger King, countless venues serve Coke.
3. Secret Formula
- Recipe is a closely guarded secret.
- Creates mystique and uniqueness.
Types of Moats:
- Strong brand (Nike, Apple, Coca-Cola).
- Network effects (Facebook, eBay).
- Cost advantages (Walmart, Costco).
- Switching costs (Microsoft, Adobe).
- Patents and IP (pharmaceutical companies).
- Scale and distribution (Amazon).
How to identify a moat:
Ask yourself: "If a competitor had $100 billion, could they beat this company?"
That’s what Warren Buffett asks when he’s thinking about investing in a company.
If the answer is no, that's a moat. No matter the resources, this company does what it does better than anyone else.
Red flag - No moat: If anyone can replicate the business easily, there's no protection. Competition will drive profits to zero.
Putting It All Together: Complete Company Analysis
Let's walk through a full analysis using Microsoft as an example.
Note: All numbers are from Microsoft’s 10-K for the 2024 fiscal year.
Step 1: Check Financial Health
Find the 10-K:
- Go to SEC EDGAR.
- Search "Microsoft" for.
- Open the most recent 10-K.
Balance Sheet Analysis:
- Total Assets: $512 billion.
- Total Liabilities: $243 billion.
- Book Value: $269 billion.
- Strong balance sheet with more assets than liabilities.
Income Statement Analysis:
- Revenue: $245 billion (up from $211 billion).
- Net Income: $88 billion.
- Revenue growing 16% year-over-year.
- Profit margin: 36% (excellent).
Cash Flow Analysis:
- Operating Cash Flow: $118 billion.
- Investing Cash Flow: -$96 billion (investing in growth).
- Financing Cash Flow: -$37 billion.
- Strong cash generation from operations.
Financial Health Score: Excellent
- Growing revenue.
- High profitability.
- Positive cash flow.
- Reasonable debt levels.
Step 2: Non-Financial Analysis
Business Model:
- Sells software (Windows, Office).
- Cloud computing (Azure).
- Gaming (Xbox).
- Diverse revenue streams.
CEO: Satya Nadella
- Became CEO in 2014.
- Transformed Microsoft culture.
- Led shift to cloud computing.
- Widely respected leader.
Innovation:
- Leading in AI (ChatGPT partnership).
- Expanding cloud infrastructure.
- Developing new products constantly.
- Heavy R&D investment.
Moat:
- Enterprise relationships (businesses rely on Office, Windows).
- Switching costs (hard to move from Microsoft ecosystem).
- Network effects (everyone uses Office formats).
- Cloud infrastructure (massive investment required to compete).
Non-Financial Score: Excellent
- Strong business model.
- Proven leadership.
- Continuous innovation.
- Massive competitive advantages.
Step 3: The Verdict
Based on complete analysis, Microsoft shows:
- ✅ Excellent financial health.
- ✅ Strong business fundamentals.
- ✅ Growing revenue and profits.
- ✅ Solid competitive position.
- ✅ Good leadership.
- ✅ Continuous innovation.
This is what a healthy company looks like.
To be clear: This is not investment advice - whether an investment is good or not is up to you and needs much more analysis to determine.
Always do your research and due diligence before investing in anything. This is just an example for educational purposes only.
How to Evaluate Financial Health in 30 Minutes
Don't have hours? Here's a quick framework.
10 Minutes: Quick Financial Check
- Find the latest 10-K on SEC EDGAR.
- Look at revenue trends (growing or shrinking?).
- Check net income (profitable or losing money?).
- Review total debt on balance sheet (high or low?).
10 Minutes: Business Check
5. Read company description (understand the business model)
6. Look up the CEO (who's running the company?)
7. Check recent news (any scandals or major issues?)
10 Minutes: Competitive Position
8. Identify main competitors
9. Assess the moat (what protects this company?)
10. Check innovation (are they keeping up or falling behind?)
This won't give you a complete picture. But it will tell you if deeper analysis is worth your time.
Tools and Resources
For Financial Data:
- SEC EDGAR (sec.gov) - Free, official source.
- Company investor relations pages.
- Yahoo Finance - Quick ratio overview.
- Google Finance - Stock price and basic data.
For Company Research:
- Company websites (About page).
- Investor presentations.
- Earnings call transcripts.
- Industry news sites.
What You Don't Need:
- Expensive subscriptions (start with free tools).
- Complex software (basic spreadsheet works).
- Financial degree (this guide gives you the framework).
Common Mistakes to Avoid
Mistake 1: Only Looking at Stock Price
A rising stock price doesn't mean the company is healthy. The price might be hype.
A falling stock price doesn't mean the company is unhealthy. It might be a buying opportunity.
Always check the fundamentals and do your own due diligence before investing.
Mistake 2: Ignoring the Balance Sheet
Many investors only look at revenue and profits. Then they're shocked when a company goes bankrupt.
Always check debt levels and cash flow. Companies have gone bankrupt while showing profits.
Mistake 3: Trusting Management Blindly
CEOs want you to invest. Their presentations show the best possible picture.
Don't just read what they say. Verify with financial statements and look at competitors to get a full well-rounded view of the industry.
Mistake 4: Comparing Different Industries
A 5% profit margin is terrible for a software company but excellent for a grocery store.
Always compare companies to their industry peers, not to different industries.
Mistake 5: Forgetting About Innovation
Even if its financials look great today, what about tomorrow?
If competitors are innovating and this company isn't, the financials will eventually deteriorate.
When to Walk Away
Sometimes analysis reveals a company isn't healthy. Here's when to avoid investing (or consider selling if you already own it).
Walk away if:
- ❌ Revenue declining for multiple quarters.
- ❌ Net income consistently negative.
- ❌ Debt increasing while revenue isn't.
- ❌ Negative operating cash flow.
- ❌ CEO turnover or scandals.
- ❌ No clear competitive advantage.
- ❌ Failing to innovate while competitors advance.
- ❌ Industry in permanent decline.
Don't fall in love with a company. If the fundamentals deteriorate, move on.
Frequently Asked Questions For Evaluating a Company’s Financial Health
How do you assess a company's financial health?
Start by assessing financial health by analyzing three financial statements: balance sheet (assets and liabilities), income statement (revenue and profits), and cash flow statement (cash generation).
Calculate key ratios like debt-to-asset ratio, profit margin, and revenue growth. Also evaluate non-financial factors: business model, CEO quality, innovation, and competitive advantages.
How to tell if a company is doing well financially?
A financially healthy company shows: growing revenue over time, positive and increasing net income, positive operating cash flow, manageable debt levels (under 70% of assets), and good profit margins (10%+).
Also check if the company innovates and has strong competitive advantages protecting it from competitors.
How can one judge if a company is doing well?
Judge company health using both financial and non-financial analysis.
Financially: check if revenue and profits are growing, debt is manageable, and cash flow is positive.
Non-financially: evaluate the business model, CEO leadership, innovation initiatives, and moat (competitive advantages). Both perspectives together give you the complete picture.
How to check if a company is debt free?
Check the balance sheet in the company's 10-K report.
Look at "Total Liabilities" - this shows all debt. Compare to "Total Assets." Calculate debt-to-asset ratio (liabilities ÷ assets).
Under 30% is low debt. Zero liabilities means truly debt-free, but this is rare even for healthy companies. And find out what a company is using its debt for.
Not all debt is bad - it just depends on how it is being used.
How to do fundamental analysis of a company?
Fundamental analysis has six steps:
(1) Find the 10-K report on SEC EDGAR.
(2) Review its balance sheet, income statement, and cash flow statement.
(3) Calculate key ratios (P/E, profit margin, debt level, revenue growth).
(4) Research its business model and CEO.
(5) Assess innovation and its competitive moat.
(6) Compare it to competitors.
Use both financial numbers and business fundamentals together.
Evaluating A Company's Financial’s: Final Thoughts
Evaluating a company's financial health isn't magic. It's a systematic process.
The two-part framework:
- Financial analysis: Read the statements, calculate ratios, spot trends
- Non-financial analysis: Understand the business, evaluate leadership, assess the moat
Professional investors use both together. Numbers without context miss problems. Context without numbers misses financial disasters.
The more you practice, the faster you'll get. Eventually, you'll be able to evaluate any company in 30 minutes.
Your goal isn't perfection. Even with doing all of this, you will eventually lose money while investing. Your goal is informed decision-making, and limiting losses, while maximizing gains.
You can’t discover every small detail about a company - but you can uncover key issues or strengths that the rest of the market isn’t pricing in.
Our market analysts are applying this level of financial analysis to every company we research on Market Briefs Pro.
This is our weekly investment report newsletter that gives you an edge on Wall Street by showing you potential investing opportunities, before the rest of the market catches on.
The report gives you real data and actual research you won’t find anywhere else and explains it in simple terms you can understand.