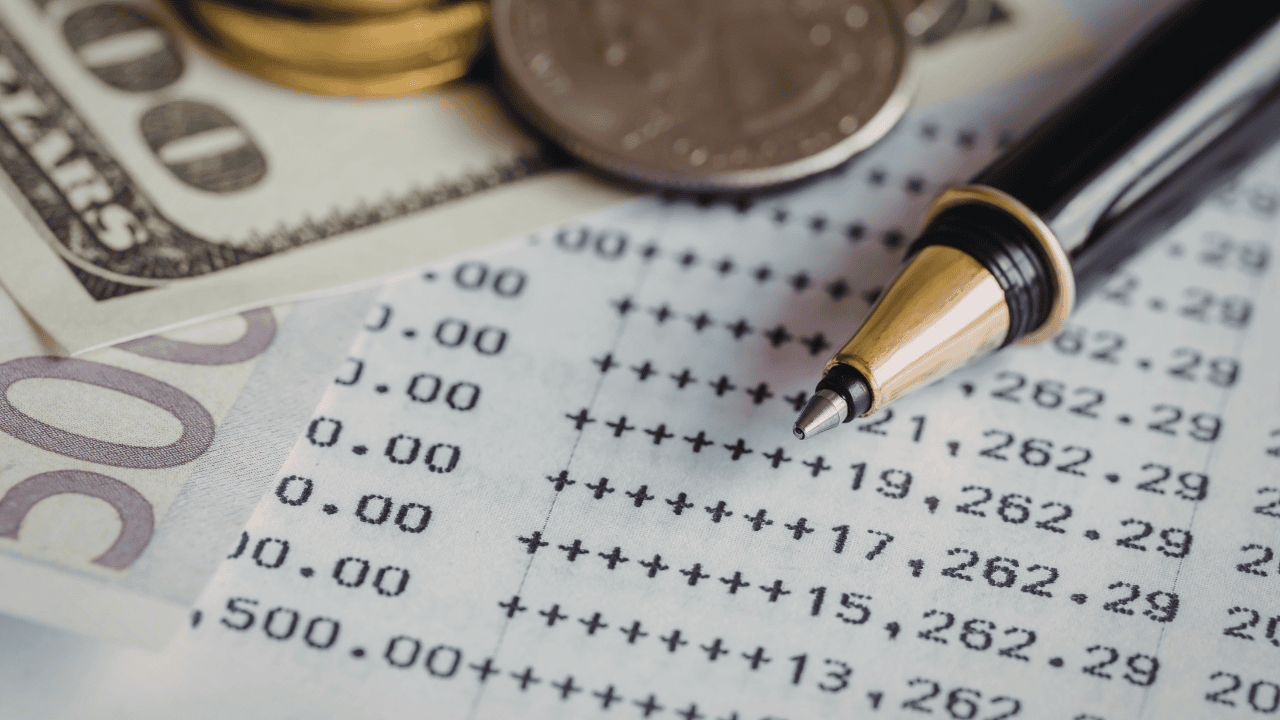
You can learn a lot about a company from its balance sheet.
You can see what it owns. What it owes. And what is left for the people who own the stock.
But there is one ratio that goes a step further. It tells you how well a company uses that leftover money to make a profit.
That ratio is return on equity. Or ROE.
It is one of the most common tools investors use to judge how well a company is run. And once you get it, you will start seeing it everywhere.
This article covers the return on equity formula, a step-by-step example using Coca-Cola's real numbers, what counts as a "good" ROE, where to find it, and the limits you need to know before relying on it.
Terms like equity, returns, and more are going to come up a lot as you invest.
So you need to know what they mean.
Our free daily newsletter Market Briefs gives you the info you need to be a smarter investor in just 5-minutes a day.
What Is Return on Equity?
Return on equity is a ratio. It shows how much profit a company makes with the money its owners have put in.
Think of it like this. You and a friend both open a lemonade stand. You each put in a hundred bucks.
At the end of the summer, your stand made twenty dollars in profit. Your friend's stand made ten.
You both put in the same cash. But your stand made more with it. Your return on equity was higher.
That is what ROE does for public companies. It shows how good they are at turning owner money into profit.
In the stock market, equity means ownership. When you buy a share, you own a piece of that company.
ROE tells you how well that company puts your piece to work.
The Return on Equity Formula
The formula is simple.
ROE = Net Income / Shareholder Equity
That is it. Two numbers.
Net income is what the company earns after paying all its bills. You can find it at the bottom of the income statement in a company's 10-K - the yearly report every public company files with the SEC.
Think of it like a profit and loss sheet. Revenue at the top. Costs in the middle. Profit at the bottom.
Shareholder equity is what is left on the balance sheet after you take away all the debt from all the stuff the company owns.
It works like this: Assets - Liabilities = Shareholder Equity.
- Assets are the good stuff - cash, buildings, gear, products on the shelf
- Liabilities are the bills - what the company owes
Take away the bills from the good stuff. What is left is equity.
It is what owners would get if the company sold it all and paid every debt.
Some call this book value. Same thing.
How to Calculate Return on Equity (Step by Step)
Let us use Coca-Cola as an example.
Step 1: Find the net income.
Go to the SEC's EDGAR site. Search for the company. Click the latest yearly report. Find the income statement.
For Coke, net income was about $10.6 billion.
Step 2: Find the shareholder equity.
Look at the balance sheet in that same report. Total assets minus total debts.
Coke had about $100 billion in assets. About $74 billion in debts.
That leaves about $26 billion in equity.
Step 3: Divide.
$10.6 billion / $26 billion = about 40.8%.
So for every dollar of equity, Coke made about 41 cents in profit.
That is a strong number. But like any ratio, it only means something when you stack it up against peers.
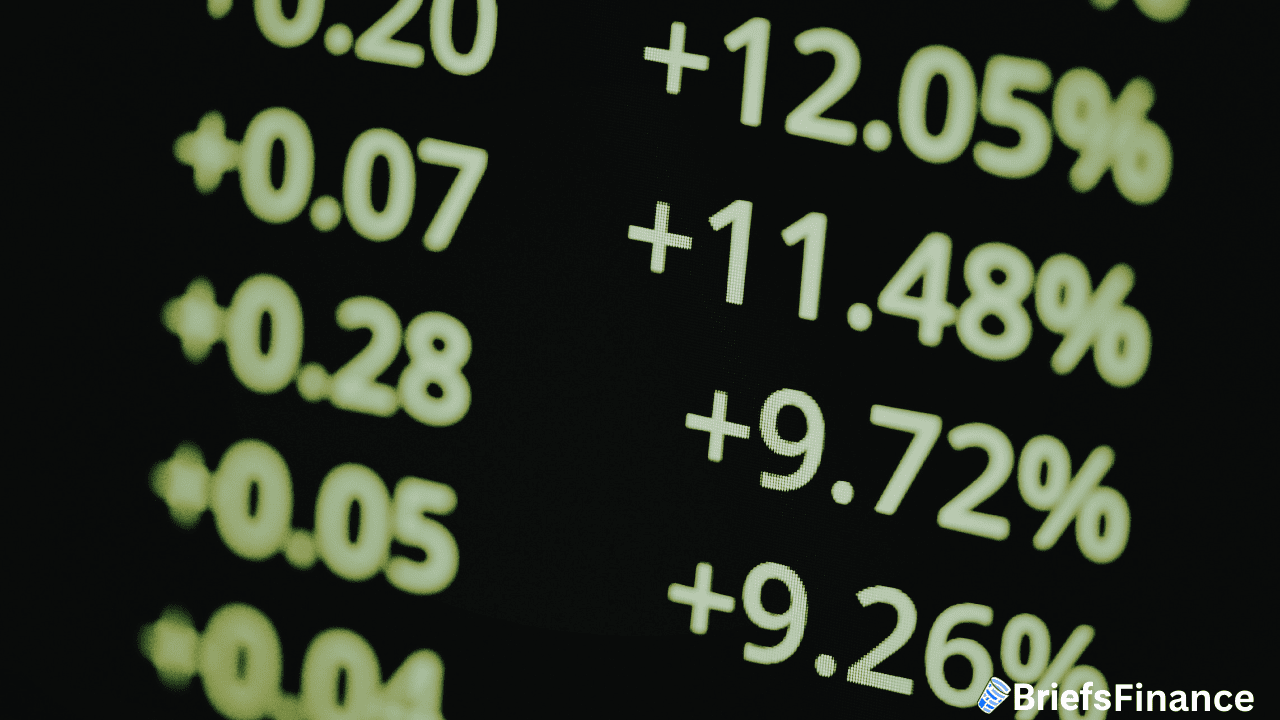
What Is a Good Return on Equity?
There is no one right number. ROE changes by industry and company size.
Here is a general guide:
- Under 10% - may mean the company is not putting equity to good use
- 10% to 20% - solid in most fields
- Over 20% - strong
- Over 30% - very high - dig deeper to see what is driving it
The key is to compare. A tech company and a power company will have very different numbers. That is normal.
It is the same idea behind the P/E ratio - stock price divided by profit per share. Or the P/B ratio - stock price divided by the book value per share. (If you want to learn more about how these ratios work in practice, check out our guide on when to buy a stock.)
These tools only work when you use them to compare similar companies.
Warren Buffett is known for loving ROE. He looks for companies that can keep it high year after year.
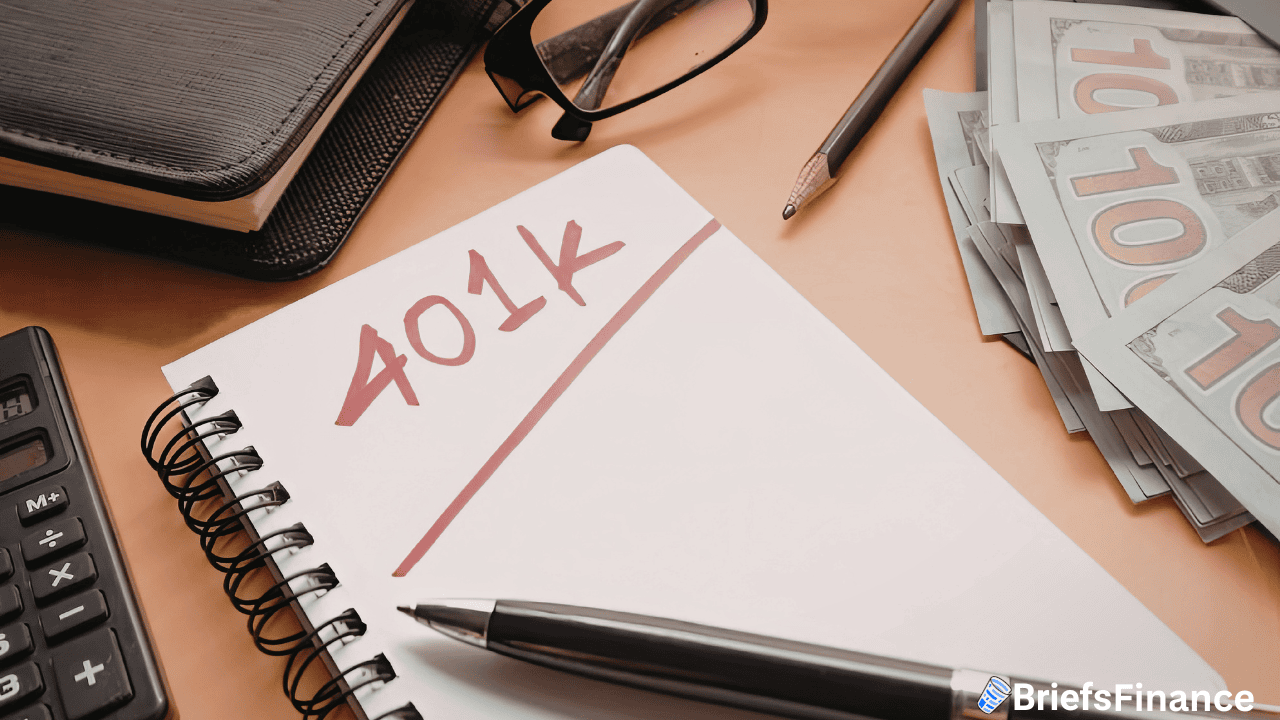
Where to Find ROE Data
You can find ROE in a company's 10-K on the SEC EDGAR site. Just search the name or ticker.
Click the latest filing. The balance sheet and income statement are both in there.
You can also search for a company's investor page. Type something like "Microsoft 10-K" into a search engine. The page should come right up.
Grab the net income. Grab the equity. Divide.
Most stock sites list it for you too. Yahoo Finance, CNBC, and most brokers show it on the stock's main page.
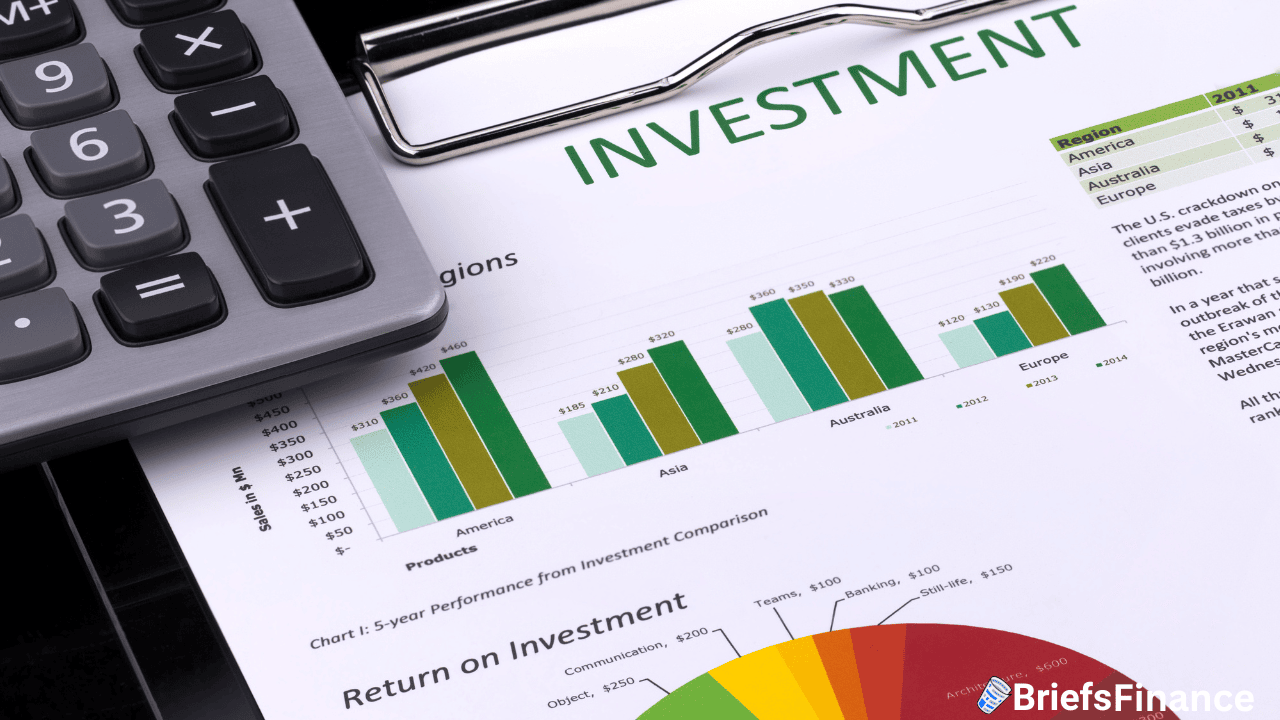
Why Return on Equity Matters for Investors
ROE links two parts of a company's finances.
The income statement shows if it is making money. The balance sheet shows what it is worth on paper.
ROE ties them together. It asks one simple question: how well does this company turn its value into profit?
A company might have a high stock price. It might look great on the surface.
But if ROE is low, it could be sitting on a pile of equity and doing nothing with it.
A high ROE means the company is wringing more profit out of every dollar investors have put in.
Here is a quick example. Two companies in the same field. Both have a similar stock price.
Company A has an ROE of 25%. Company B has an ROE of 8%.
Company A is clearly doing more with its equity. That might make it a stronger pick. But do not stop there.
The Limits of Return on Equity
No one ratio tells the whole story. ROE has some gaps.
Debt can make ROE look higher than it should. Here is why.
Equity is assets minus debts. If a company takes on a ton of debt, the equity shrinks.
Since equity is on the bottom of the formula, a smaller number pumps up the ROE.
So a company loaded with debt might show a great ROE. Not because it is doing well. But because the equity base is small.
That is why smart investors look at ROE along with other tools.
Check the P/E ratio. Check the P/B ratio. Check the debt on the balance sheet. (For a deeper look at what goes into a company's debt and cash flow, we have guides on those too.)
ROE does not help with companies that lose money. If net income is negative, you get a negative ROE.
For young companies still losing cash, investors might look at sales growth or the price-to-sales ratio instead.
One year is not enough. A single year can be off because of a one-time event - a legal bill, a big write-off, or a windfall.
Look at several years to see if the company can keep ROE up over time.
The Bottom Line
Return on equity shows one thing: how well a company turns owner money into profit.
The math is net income divided by equity. Both numbers are in the 10-K.
Higher is usually better. But always compare within the same field. And always check the debt to make sure it is not faking the number.
ROE is one tool in your kit. Use it with the P/E ratio, P/B ratio, and cash flow analysis to see the full picture before making any moves.
If you are just getting started with financial literacy and want to understand how the capitalist economy rewards ownership, learning ratios like ROE is a great first step.
And if you are ready to go deeper, our guides on how to buy stocks, how much to invest, and the difference between trading vs investing can help you build from here.
If you want daily financial news you can actually use, subscribe to Market Briefs for free.