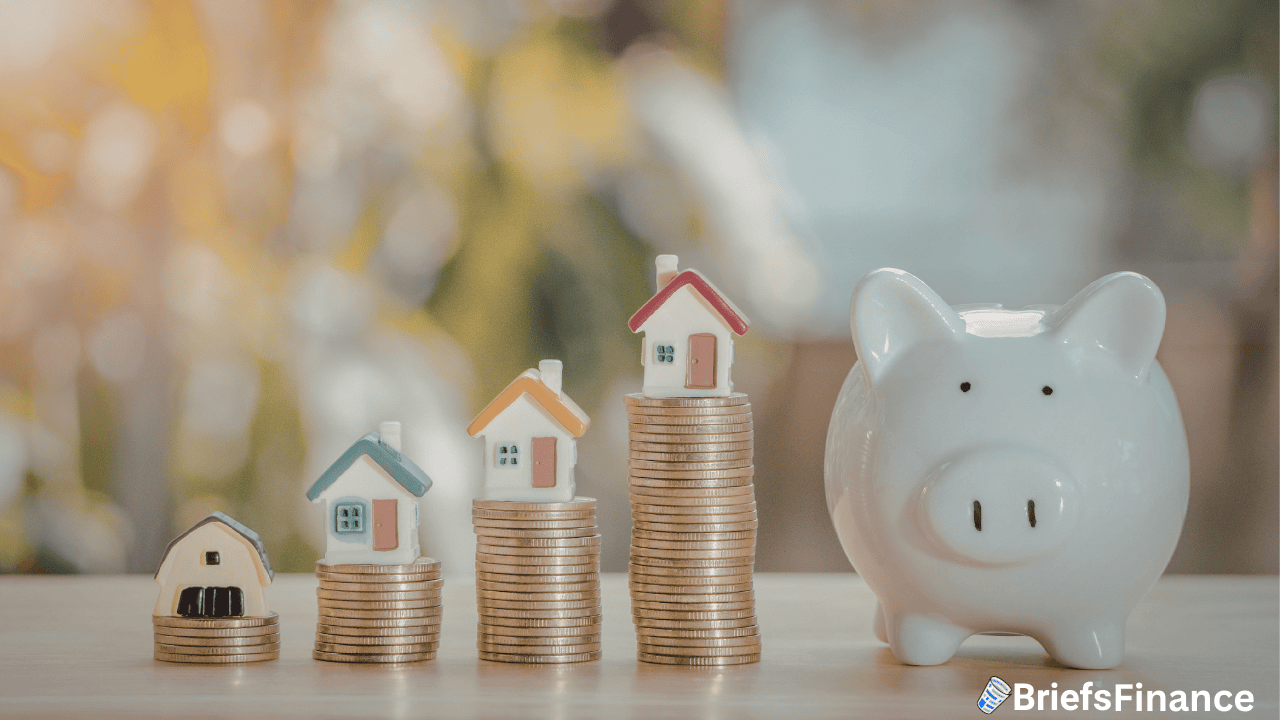
If you've ever checked your own net worth - added up what you own and subtracted what you owe - you already understand the basic idea behind a balance sheet.
A balance sheet does the exact same thing - except for a company.
Investors often look at a company’s balance sheet to see what a company owns, what it owes, and what might be left over for shareholders.
It’s when evaluating a company’s financials, and one of the three major parts of a 10-K or 10-Q financial statement, along with a company's income statement and cash flow statement.
In short - if you want to be a better investor, you need to learn how to read a balance sheet.
But what exactly are you looking for?
Let’s break down what a balance sheet is, where you find it, the 3 major parts, and why it matters for investors.
Our market analysts are evaluating stocks every day and finding potential opportunities the rest of the market might be missing.
Join our CEO Jaspreet Singh on March 18th for a free live investor workshop to learn how we spot market shifts and stocks that may be worth keeping an eye on.
Register for the workshop here.
What Is a Balance Sheet?
A balance sheet is a financial snapshot. It shows a company's assets, liabilities, and shareholder equity at a specific point in time.
The golden rule of every balance sheet? It must balance.
The numbers always follow this equation:
Assets = Liabilities + Shareholder Equity
Think of it like your personal finances. Everything you own (your car, savings, investments) minus everything you owe (your mortgage, credit card debt, student loans) equals your net worth.
A balance sheet works the same way.
Where Do You Find a Balance Sheet?
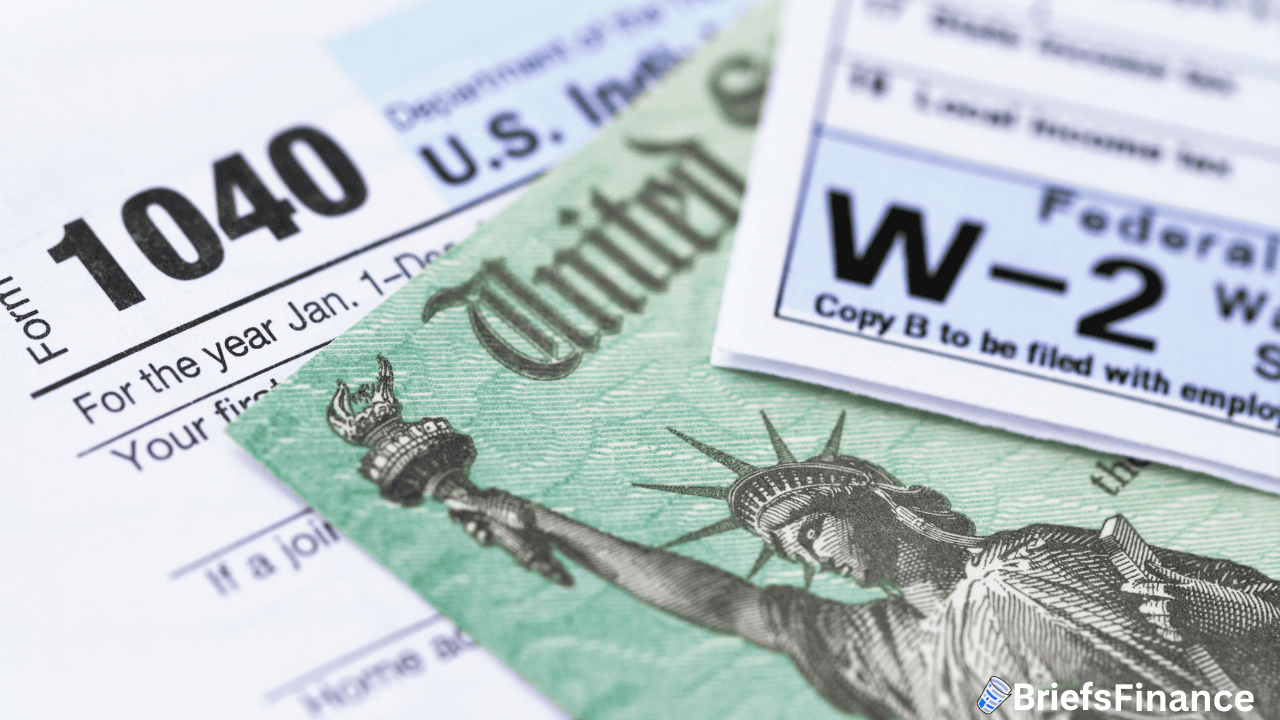
Public companies are required to file annual financial reports called 10-Ks and 10-Qs. Inside every 10-K, you'll find three core financial statements:
- The balance sheet.
- The income statement.
- The cash flow statement.
You can find any public company's 10-K for free on the SEC's EDGAR database at sec.gov. Just search the company name or ticker symbol.
The 3 Parts of a Balance Sheet
1. Assets - What the Company Owns
Assets are split into two categories:
| Type | What It Means |
| Current Assets | Can be converted to cash within 12 months |
| Non-Current Assets | Takes longer than 12 months to liquidate |
Current assets include things like cash, accounts receivable (money customers owe the company but haven't paid yet), and inventory (unsold products sitting on shelves).
Non-current assets include property, equipment, buildings - and something called goodwill, which is a catch-all for intangible value like brand reputation and intellectual property that a company acquired through purchases.
Add them together and you get total assets.
2. Liabilities - What the Company Owes
Liabilities are also split into two buckets:
| Type | What It Means |
| Current Liabilities | Debts due within the next 12 months |
| Non-Current Liabilities | Debts due beyond 12 months |
Current liabilities include accounts payable (bills the company hasn't paid yet), short-term debt, and any other near-term obligations.
Non-current liabilities include long-term loans and bonds.
Add them up and you get total liabilities.
3. Shareholder Equity - What's Left for Investors
After paying off all liabilities, whatever remains belongs to shareholders.
That's shareholder equity - also called book value.
This is also where you'll find retained earnings: the profits the company has kept over time instead of paying out as dividends.
The equation holds:
Shareholder Equity = Total Assets − Total Liabilities
A Real Example: Coca-Cola
To make this concrete - let’s use a real example.
At one point in time Coca-Cola's balance sheet showed total assets of around $100 billion.
After subtracting liabilities, the shareholder equity figure appears at the bottom of the sheet.
And here's the key: The total liabilities and equity number at the very bottom equals the total assets number at the very top.
It balances.
Why Does the Balance Sheet Matter to Investors?
One of the most powerful ways to use a balance sheet is to calculate a company's book value - then compare it to the company's market capitalization (what the stock market says the whole company is worth).
If a company's market cap is much higher than its book value, the market believes the company has future earning power - brand strength, patents, competitive advantages - beyond what the numbers show.
If the market cap is lower than book value, the market may think the company is struggling, or it could signal a potential value opportunity.
This is the foundation of the Price-to-Book (P/B) ratio - a key metric used by value investors to evaluate whether a stock is cheap or expensive relative to what the company actually owns.
Why is this so powerful? Legendary investor Carl Ichan used book value to build his fortune.
In the 1980s, Icahn identified Trans World Airlines as a potential opportunity by determining its market cap was lower than its book value.
To him, this was an undervalued opportunity - he then bought a major stake in the company, sold off many of its assets, and made a profit.
Balance Sheet vs. Other Financial Statements
| Statement | What It Shows |
| Balance Sheet | What the company owns and owes (snapshot) |
| Income Statement | Revenue, expenses, and profit over a period |
| Cash Flow Statement | How cash moves in and out of the business |
You need all three to get a full picture of a company’s financials.
But the balance sheet is the foundation - it tells you the financial health of a company at a glance.
Balance Sheet: The Bottom Line
A balance sheet isn't just an accounting document. It's a window into a company's financial health.
It tells you how much a company owns, how much it owes, and how much is left for shareholders.
For investors, knowing that information is incredibly important as you evaluate whether or not it is a good investment for you or not.
Once you get comfortable reading one, you'll start to see stocks differently - not just as prices move on a screen, but as real businesses with real assets, real debts, and real value.
That makes you a smarter, savvier, investor overall.
Smarter investors know how to do more than just read financial statements - they know how to spot market shifts.
Our CEO Jaspreet Singh is hosting a free live investor workshop on March 18th where he’s breaking down how we identify market shifts and potential opportunities.
Save your seat here - but act fast, spots are limited.