You wouldn't buy a house without looking at the inspection report.
So why would you buy a stock without reading the company's balance sheet?
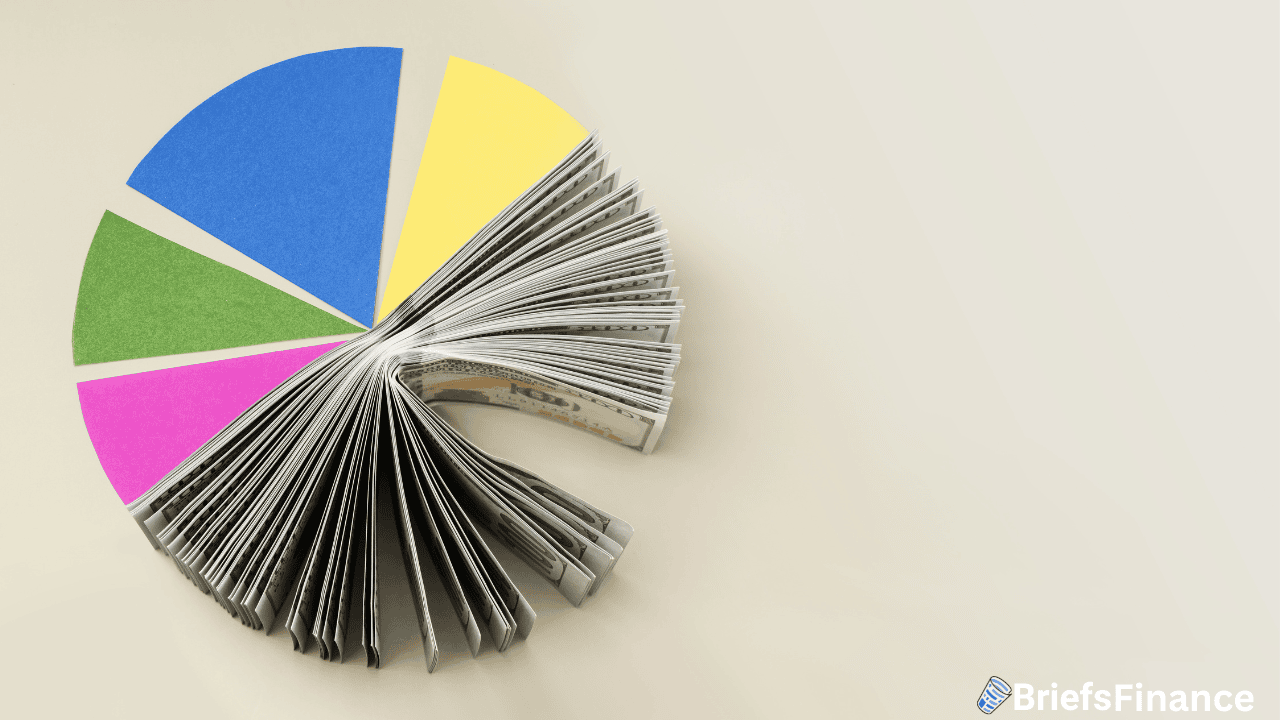
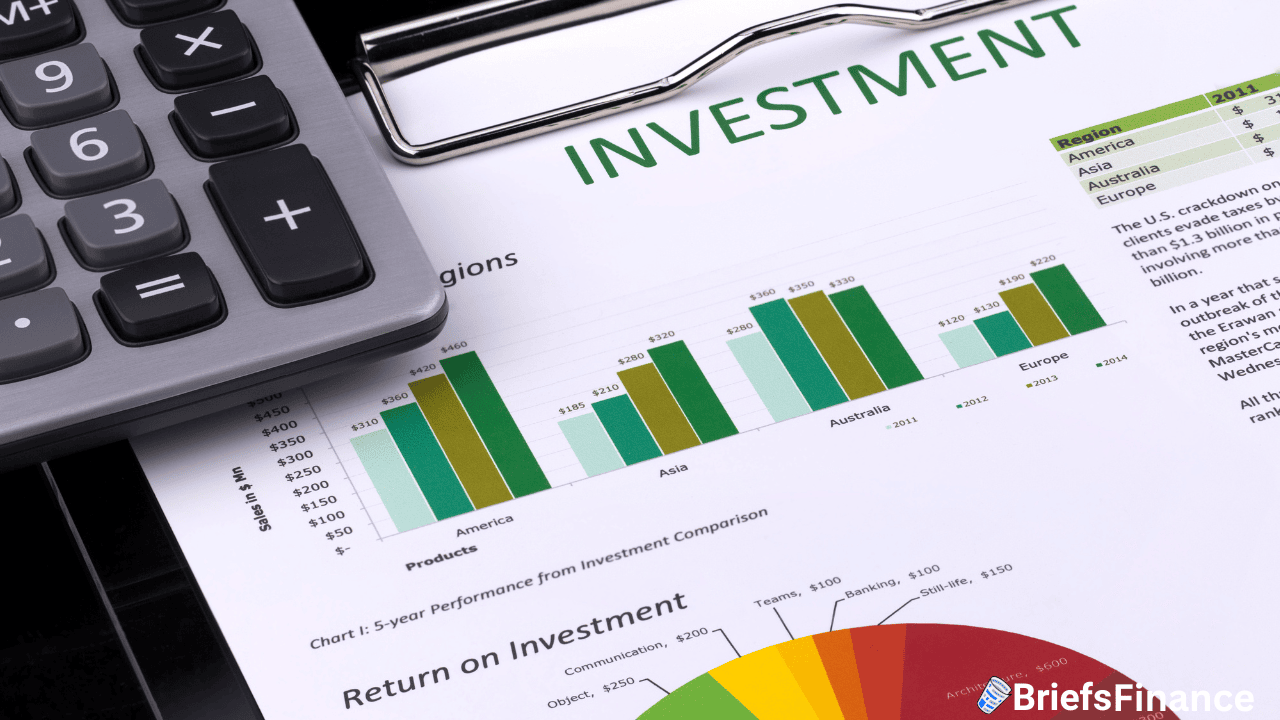
A balance sheet is one of three major financial statements every public company is required to publish. It tells you what a company owns, what it owes, and what's left over for shareholders like you.
And once you know how to read one, you can start making smarter decisions about the companies you invest in.
So let's break down what a blance sheet is, how to read one, and why they matter for investors.
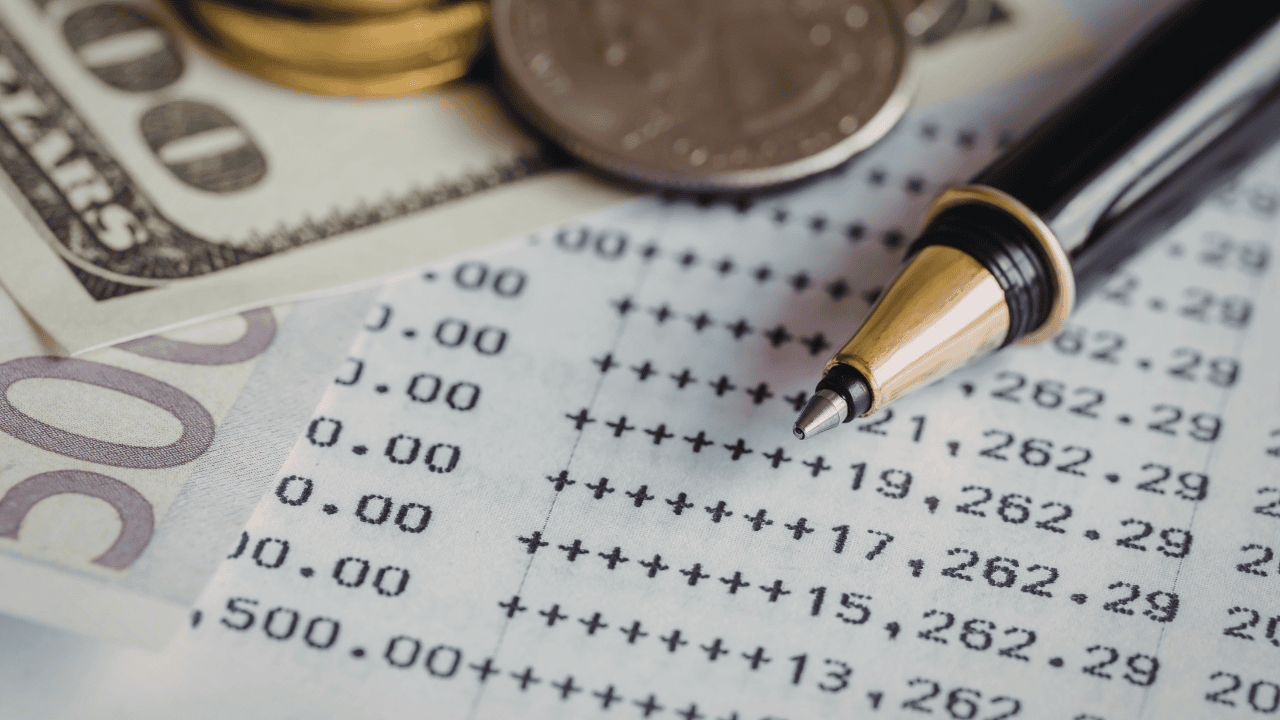
And as an investor, balance sheets are going to come up a lot, especially as companies report how much they earned every quarter.
In our free daily newsletter Market Briefs, we show you what these numbers mean and why they are important, while covering all of the other top headlines in the financial world.
Subscribe to Market Briefs by clicking here.
What Is a Balance Sheet?
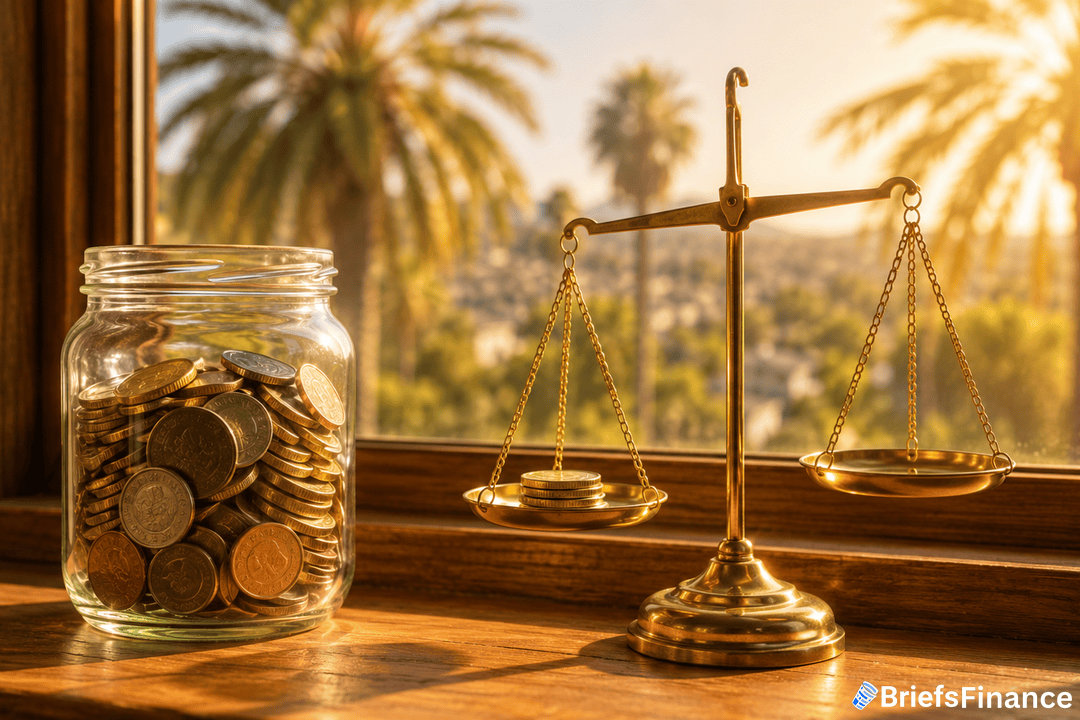
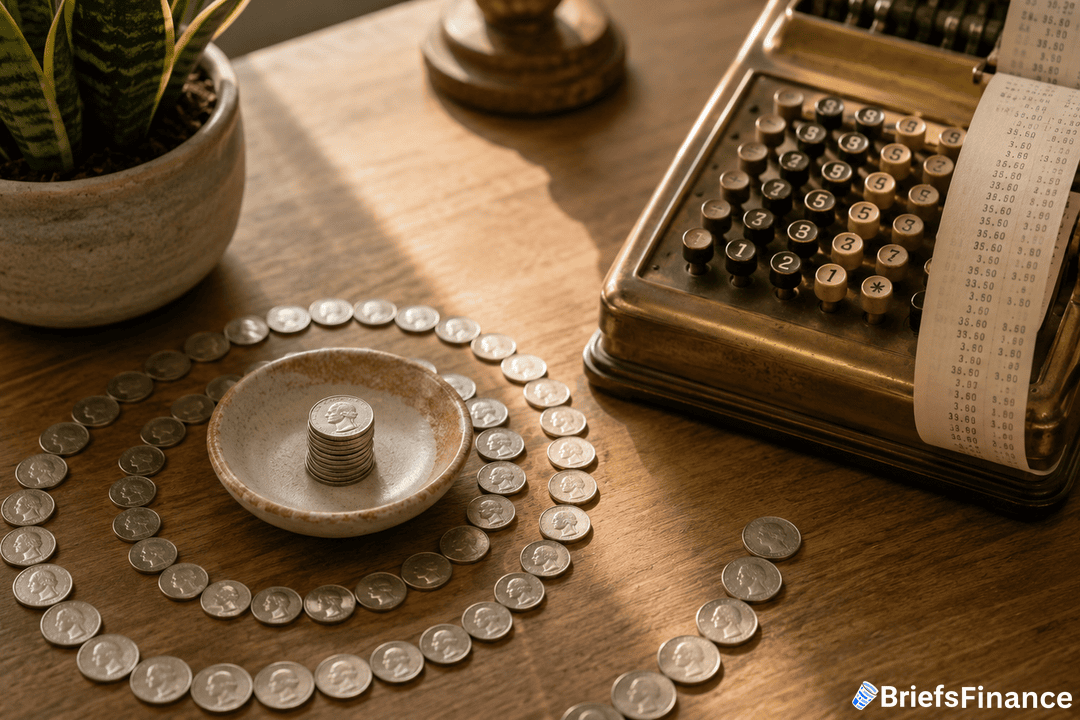
Think of a balance sheet like a company's net worth statement.
It compiles everything that's worth money - the company's assets - and everything that costs money - its liabilities.
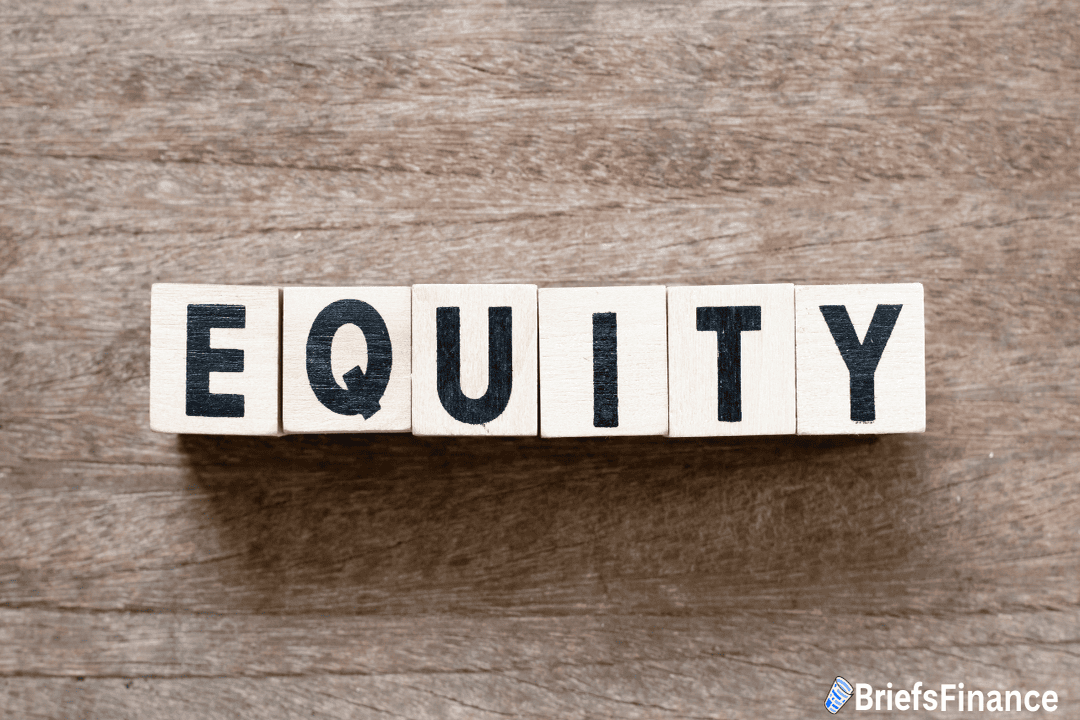
Whatever is left over is called shareholder equity, which represents the claim shareholders have on the company's assets once all debts are paid.
The whole thing runs on one formula:
Assets = Liabilities + Shareholder Equity
That equation has to balance every single time. That's why it's called a balance sheet.
Where Do You Find a Balance Sheet?
Every public company files a 10-K - an annual audited report that gives you a full snapshot of the company's financials during its fiscal year. There's also the 10-Q, which is a quarterly unaudited version.
You can find these reports in a few ways:
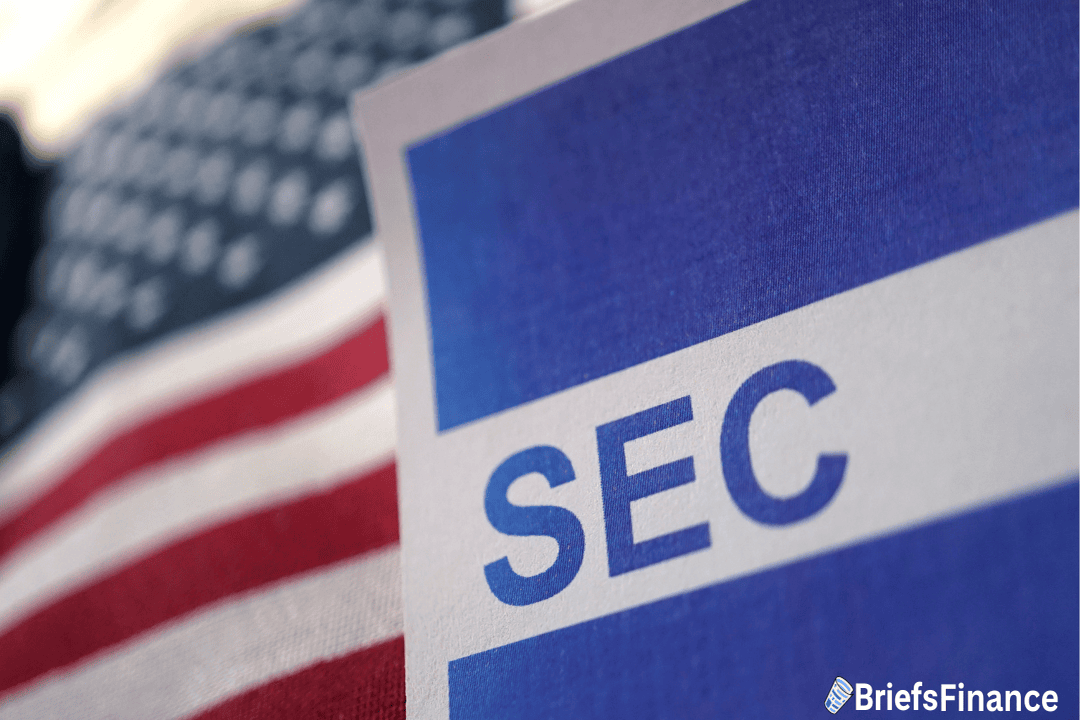
- Go to the SEC's EDGAR website and search for the company by name or ticker symbol.
- Go to the company's investor relations page (just Google the company name plus "10-K").
- Use platforms like Yahoo Finance or Seeking Alpha, which pull the same data in a more visual format.
On the SEC's EDGAR site, the financial statements are usually in Item 8 of the 10-K. Once you find it, the balance sheet is the first financial statement you'll come across.
The Three Parts of a Balance Sheet
Let's break down what you'll actually see when you open one up.
1. Assets - What the Company Owns
Assets are the valuables a company has. They're split into two categories:
- Current assets - things that can be turned into cash within the next 12 months. This includes cash, marketable securities (stocks or bonds the company owns), accounts receivable (money customers owe the company but haven't paid yet), and inventories (unsold products sitting on shelves).
- Non-current assets - things that still have value but would take longer than a year to sell. Think buildings, land, computers, and heavy machinery.
You'll see this listed as "net property and equipment," which means the value after depreciation - the gradual decline in an asset's value over time as it gets used up or wears down. Think of it like a car losing value the more you drive it.
You'll also see something called goodwill on many balance sheets. Goodwill is essentially a catch-all for intangible value - things like brand recognition or patents that don't show up as physical assets.
Add the current and non-current assets together and you get total assets.
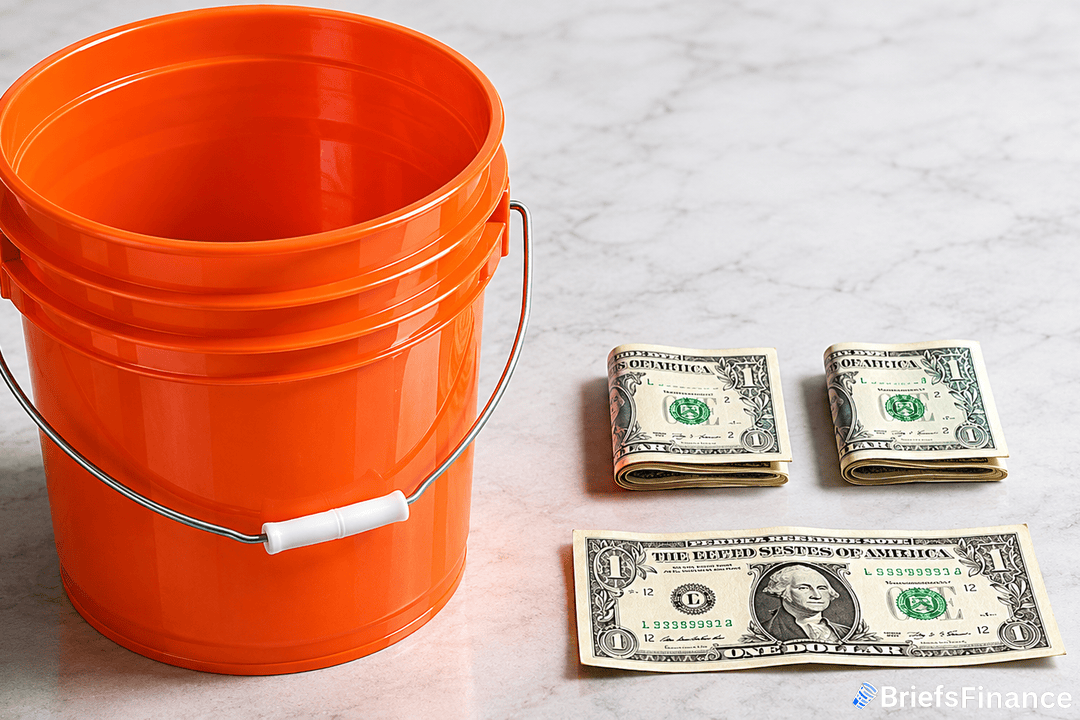
2. Liabilities - What the Company Owes
Liabilities are the company's debts and obligations. They're split the same way as assets:
- Current liabilities - debts that need to be paid within the next 12 months. This includes things like accounts payable (bills the company owes but hasn't paid yet - the opposite of accounts receivable), short-term debt, and outstanding payments on longer loans.
- Non-current liabilities - debts that are due beyond 12 months. This is usually long-term debt like bonds or multi-year loans.
Add these together and you get total liabilities.
It's normal for liabilities to increase over time, but investors want to make sure they aren't increasing faster than assets or income. That's a red flag.
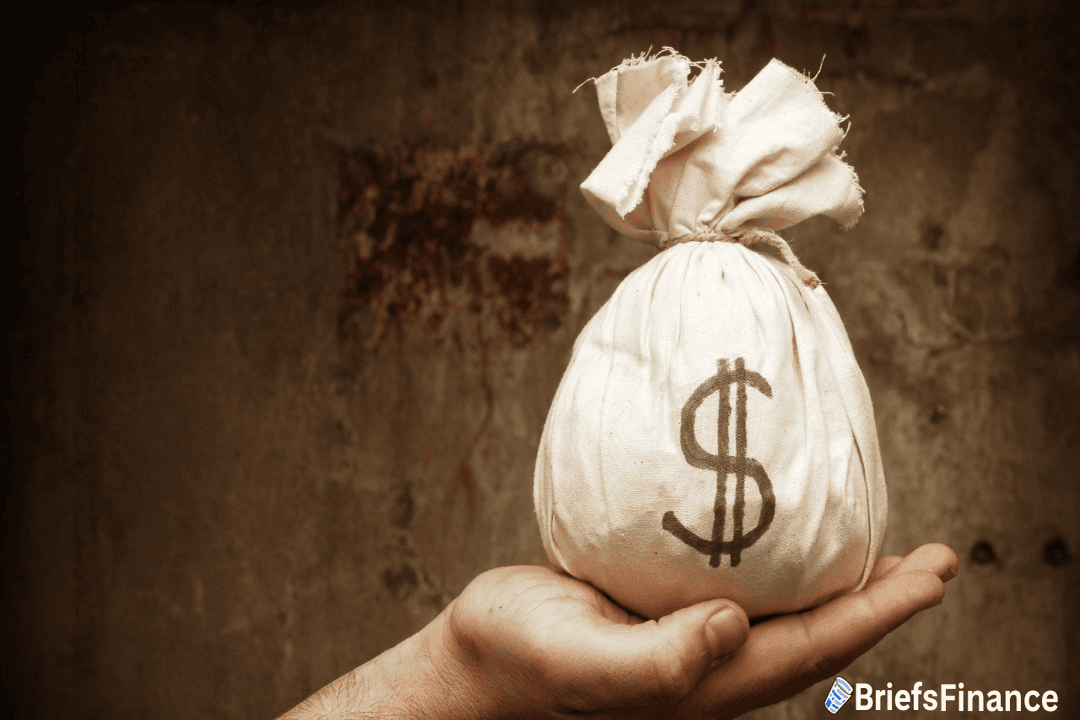
3. Shareholder Equity - What's Left for Investors
Once you subtract total liabilities from total assets, you get shareholder equity.
This number represents what shareholders would theoretically receive if the company sold everything it owned and paid off every debt. It's also known as the company's book value.
And here's where the balance sheet gets its name - when you add total liabilities and shareholder equity together, that number equals total assets. It always balances.
How to Read a Balance Sheet With a Real Example
So what does all of this actually look like on a real balance sheet?
When Coca-Cola filed its 10-K, it reported total assets of about $100 billion. Its total liabilities came in at around $74 billion.
That means Coke's book value - its shareholder equity - was roughly $26 billion.
Quick heads up on reading the numbers: most balance sheets list figures in millions. So when you see "100,549" on Coca-Cola's balance sheet, that's actually $100.5 billion. Always check the fine print at the top of the statement to see how the numbers are denominated.
Now look at the bottom of the balance sheet. You'll see "total liabilities and stockholders' equity" - and it matches total assets exactly. That's the balance sheet doing what it's supposed to do.
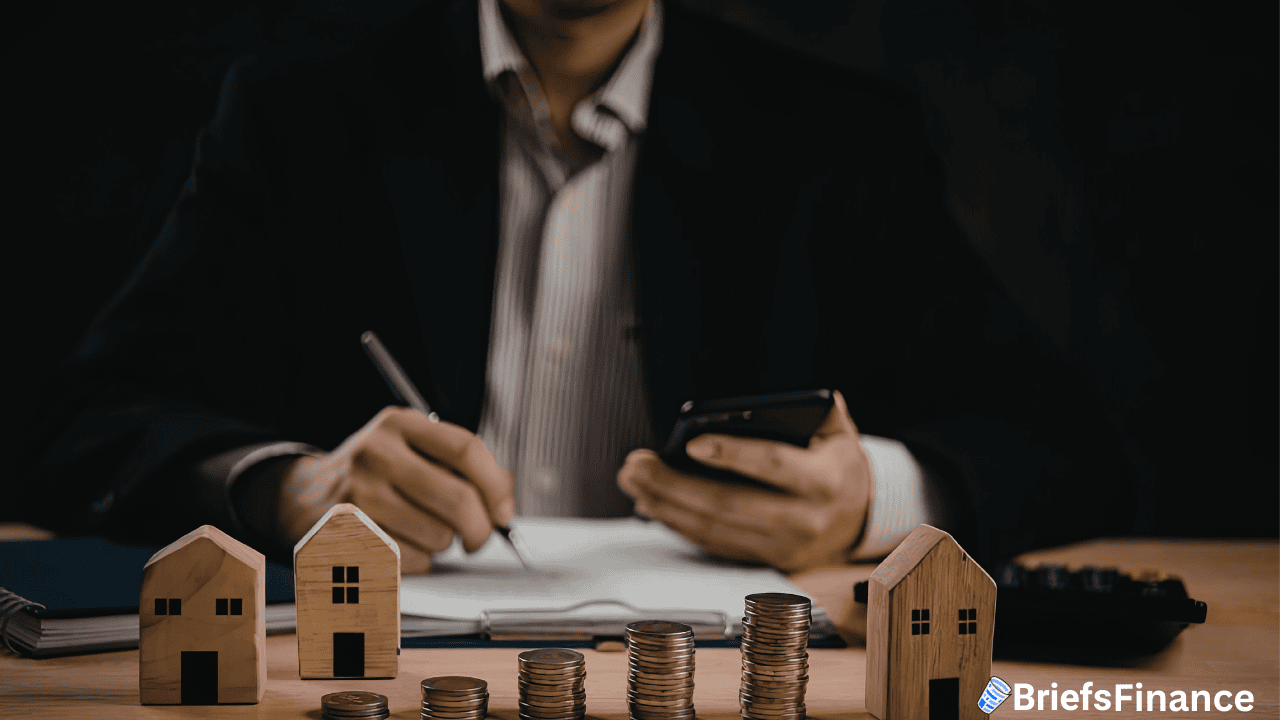
Why the Balance Sheet Matters for Investors
Reading a balance sheet isn't just about understanding accounting. It's one of the first steps in figuring out whether a company might be overvalued or undervalued.
One of the most common ways investors use it is by comparing a company's book value to its market capitalization - the total value of all its shares on the stock market.
Take Home Depot. Its total assets were around $76 billion and its total liabilities were about $74 billion. That left roughly $1.5 billion in book value.
But Home Depot's market cap was around $294 billion. That means investors believed the company was worth far more than just its assets on paper - because of its earning potential, brand, and competitive position.
Now flip that around. If a company's book value were higher than its market cap, some investors would see that as a potential opportunity.
The famous investor Carl Icahn built a career doing exactly this - finding companies where the assets on the books were worth more than what the stock market said the company was worth, then buying in to unlock that value.
This type of analysis - comparing book value to market cap - is called the price-to-book ratio, or P/B ratio. Here's a quick way to read it:
- P/B below 1.0 - could signal an undervalued company. You're paying less than what its net assets are worth on paper.
- P/B equal to 1.0 - fairly valued. You're paying roughly what the company's assets are worth.
- P/B above 1.0 - could mean the market is pricing in intangible value like growth potential, brand strength, or competitive advantages that don't show up on the balance sheet.
Just remember - no single metric tells the full story. The balance sheet is just one piece of the puzzle.
You also want to look at the income statement - a company's profit and loss report - and the cash flow statement, which shows how money actually flows through the business.
Valuation ratios like the P/E ratio (how many times earnings you're paying for a stock) and the PEG ratio (whether that price is justified by future growth) also help round out the picture before making any investment decisions.
Reading A Balance Sheet: Final Thoughts
A balance sheet shows you the financial foundation of a company. It answers three questions: What does the company own? What does it owe? And what's left over for shareholders?
Once you can read one, you can start comparing companies, spotting potential red flags, and building a more complete picture of where your money might be best invested.
The best investors in the world spend days researching these statements. You don't have to go that deep on day one - but knowing how to read a balance sheet gives you a head start most investors never bother to take.
Every day, we're breaking down the top news in our free daily newsletter, Market Briefs.