Every investor knows: The goal of investing is to watch your investment gain value.
But that’s just one way investors make money.
There’s another way: Cashflow.
What does that mean? Some stocks will pay you just for investing in them - these are called dividends.
A company decides to pay a dividend with leftover profits - think of it kind of like a thank you for investing in them.
Here’s the thing though - not every stock pays a dividend. And companies are also not required to pay a dividend.
So, for the ones that do pay a dividend: How do you know home much cash they will pay you and when?
Dividend yield tells you exactly that.
For investors seeking income, it’s one of the most important formulas you need to know.
The good news: Calculating it takes about 30 seconds once you know the formula.
Let’s break down what a dividend yield is, how to calculate it, and what it tells you about dividend stocks.
Once you know a stock's dividend yield, how do you know if it’s the right investment for you?
Get all of the data and research you need to make smarter investment decisions with Market Briefs Pro.
We’re breaking down new potential investment opportunities every week - subscribe here.
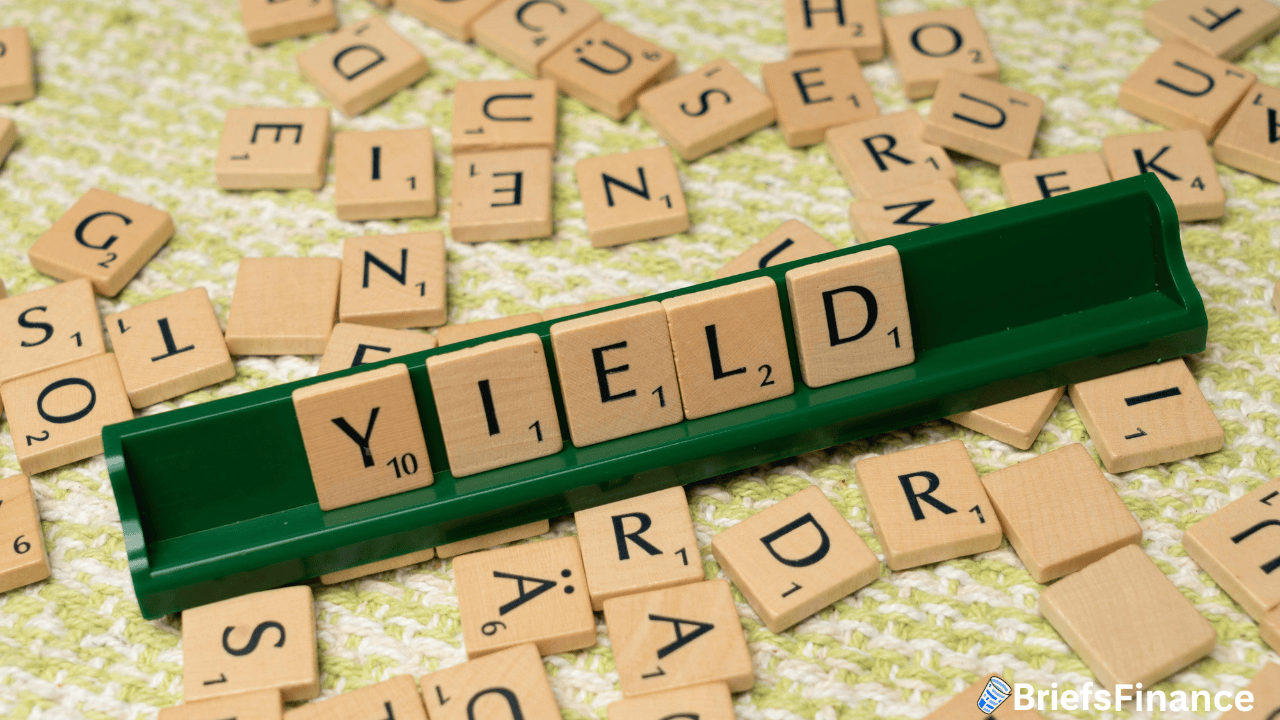
What Is Dividend Yield?
Dividend yield is a percentage that shows how much a company pays you in dividends relative to its stock price.
Think of it like this: If you put money in a savings account earning 2% interest, you'd earn $2 for every $100 you deposit.
Dividend yield works the same way - it tells you what percentage return you're getting just from the dividends.
The yield represents cash that gets deposited into your brokerage account (usually quarterly) just for owning the stock.
The Dividend Yield Formula
Here's the formula:
Dividend Yield = (Annual Dividend Per Share ÷ Current Stock Price) × 100
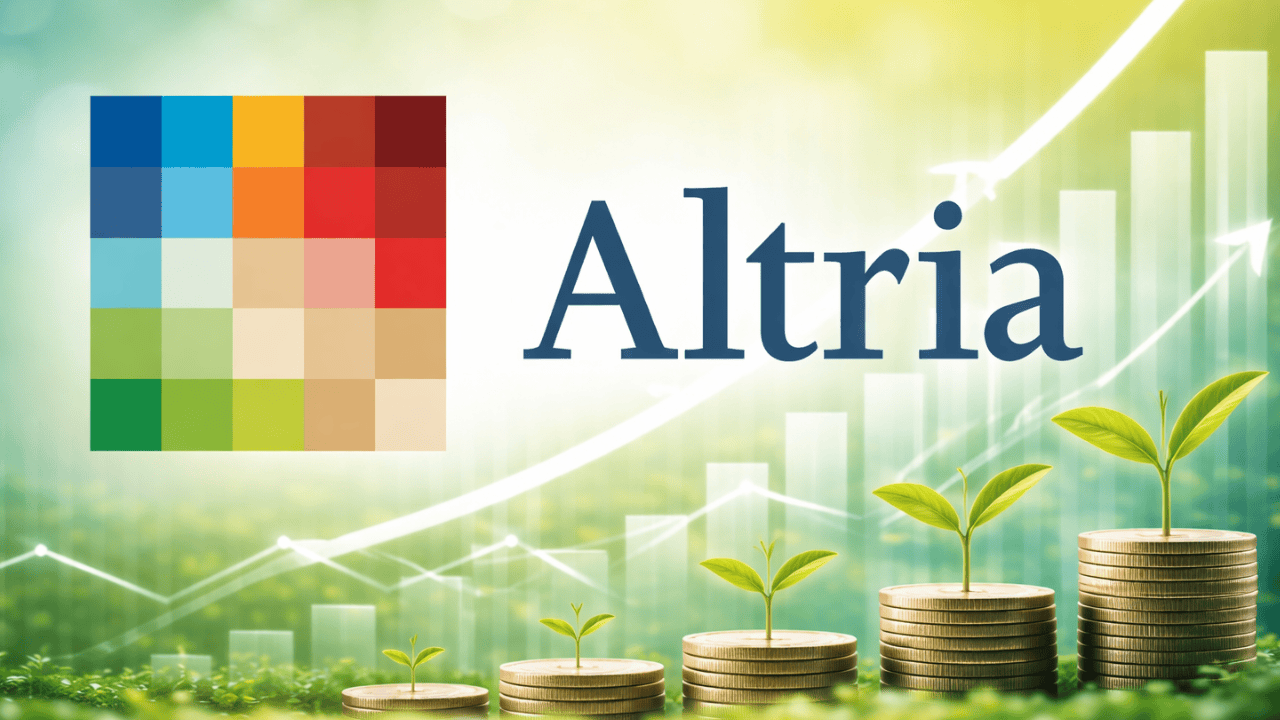
Let's use a real example: Exxon Mobil.
Note: All numbers are from Q2 2025.
| Metric | Value |
| Current share price | $102.64 |
| Annual dividend per share | $3.96 |
| Dividend yield | 3.87% |
| Payment frequency | Quarterly (about $0.99 per quarter per share) |
Here's how we got that 3.87%:
$3.96 ÷ $102.64 × 100 = 3.87%
This means if you own one share of Exxon Mobil at $102.64, you'll receive $3.96 per year in dividends - paid out about $0.99 every quarter.
Dividend Yield Calculator
Breaking Down The Calculation Step-by-Step
Step 1: Find the Annual Dividend Per Share
This is how much the company pays per share over a full year.
Most companies pay quarterly, so you might see something like "$0.99 per quarter” on a financial website like Yahoo! Finance.
Multiply the quarterly payment by 4 to get the annual dividend:
$0.99 × 4 = $3.96 annual dividend
You can usually find this information on financial websites, your brokerage platform, or the company's investor relations page.
Step 2: Find the Current Stock Price
This is straightforward - just look up what the stock is trading at right now. For Exxon Mobil, let's say it's $102.64.
Step 3: Divide and Multiply by 100
Take the annual dividend and divide it by the current stock price, then multiply by 100 to convert to a percentage:
($3.96 ÷ $102.64) × 100 = 3.87%
That's it! You've calculated the dividend yield.
What Your Dividend Yield Actually Means
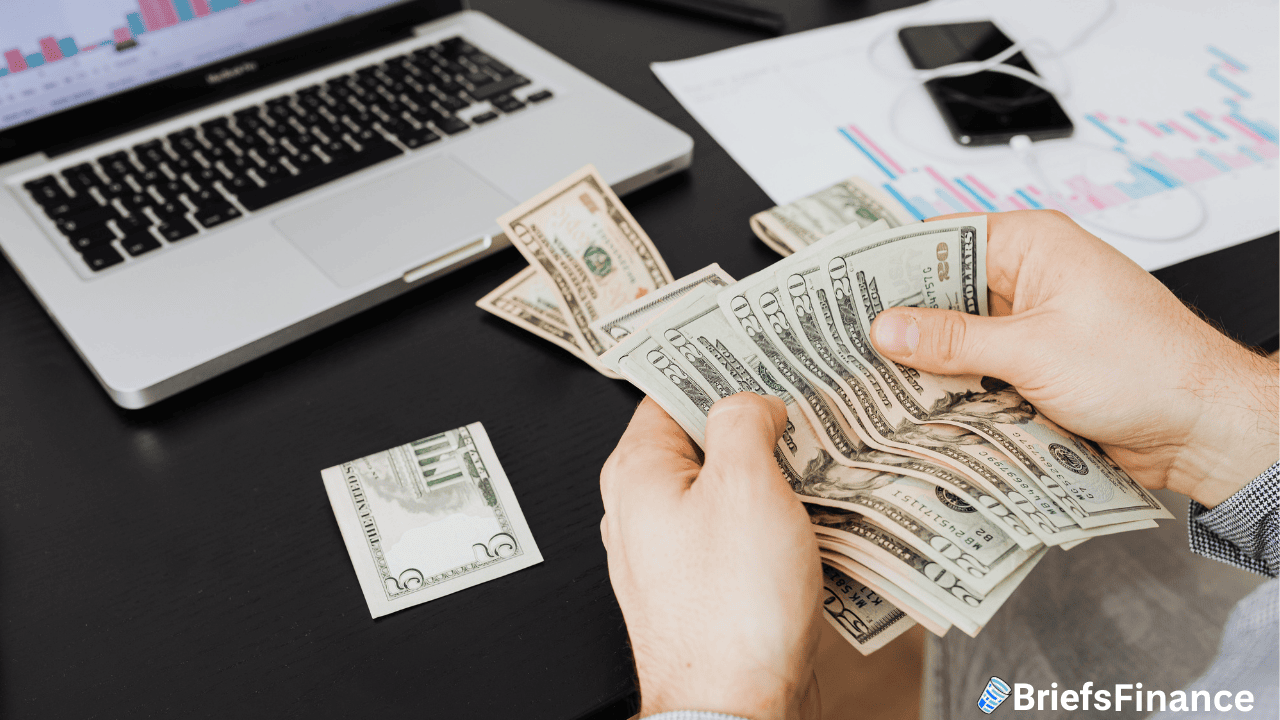
A 3.87% yield means you're earning $3.87 for every $100 you invest in the stock.
Let's scale this up:
- 1 share = about $4 per year.
- 10 shares = about $40 per year.
- 100 shares = about $400 per year.
- 1,000 shares = about $4,000 per year.
- 10,000 shares = about $40,000 per year.
The more shares you own, the more passive income you generate. And remember - this is in addition to any price appreciation the stock might experience.
What's a Good Dividend Yield?
This is where context matters. There's no single "good" number that works for everyone.
Here's a general breakdown:
| Yield Range | What It Typically Means |
| 0-2% | Lower yield, usually growth-focused companies |
| 2-4% | Moderate yield, balanced companies |
| 4-6% | Higher yield, more income-focused |
| 6%+ | Very high yield - could be a red flag |
Dividend growth investors often target yields between 2-4% from companies with strong track records of increasing dividends every year.
High-yield investors might chase yields above 4-5% for maximum current income, but this comes with higher risk.
Warning: Super high yields (8%, 10%, or more) may signal problems.
Often these exist because:
- The stock price has crashed (which automatically increases the yield percentage).
- The dividend is unsustainable and likely to be cut.
- The company is in financial trouble.
Always look at the underlying business fundamentals, not just the yield number.
Dividend Aristocrats: The Gold Standard
Some companies have increased their dividends for 25+ consecutive years. These are called Dividend Aristocrats.
Exxon Mobil is one of them - with over 40 years of dividend growth.
Even during the 2020 oil crisis, when oil prices crashed, Exxon Mobil kept its dividend flat rather than cutting it.
That's the kind of reliability income investors look for.
Other Dividend Aristocrats include:
- Procter & Gamble (P&G).
- Johnson & Johnson.
- Coca-Cola.
- McDonald's.
- 3M.
Some companies have done even better.
Dividend Kings are companies that have increased dividends for 50+ consecutive years.
These consistent increases demonstrate strong business fundamentals and management commitment to shareholders.
How Dividend Yield Changes Over Time
Your dividend yield won't stay fixed forever. It changes for two main reasons:
1. Stock Price Fluctuations
If the stock price drops but the dividend stays the same, the yield goes up.
If the stock price rises but the dividend stays the same, the yield goes down.
Example: If Exxon Mobil's price dropped to $90 but they kept paying $3.96 annually:
$3.96 ÷ $90 × 100 = 4.4%
The yield increased - but not because the company is paying you more.
2. Dividend Increases or Cuts
Companies can increase, decrease, or even suspend dividends based on business performance.
During good times, strong companies raise their dividends. This is what Dividend Aristocrats do consistently.
During recessions or tough periods, companies might cut dividends to preserve cash.
During the COVID pandemic in 2020, many companies reduced or suspended dividends - airlines, retailers, banks, and more.
There's no legal requirement forcing companies to pay dividends, so they can stop anytime.
Using Dividend Yield in Your Investment Strategy
Calculating dividend yield is just the beginning - Here's how some investors may apply this information:
Strategy 1: Dividend Growth Investing
Some investors target moderate yields (2-4%) from companies with consistent dividend growth.
The idea: Your initial yield might be lower, but the company increases that dividend year after year.
Over time, your "yield on cost" (dividend yield based on what you originally paid) becomes very attractive.
This strategy fights inflation and may build wealth reliably.
Strategy 2: High Yield Investing
Investors willing to take on more risk may target above-average yields (4-6%+) to maximize current income.
The tradeoff: Higher risk and typically less growth potential. You need to carefully assess whether the dividend is sustainable.
The Reinvestment Power Move
Most brokerages let you set up automatic dividend reinvestment plans (DRIPs).
What’s that? They automatically use your dividend payments to buy more shares - sometimes even fractional shares so every penny gets reinvested.
Using our Exxon Mobil example with a 3.87% yield:
How many shares do you need to buy an additional share each year from dividends?
Formula: 100 ÷ dividend yield
100 ÷ 3.87 = 25.83
So roughly 26 shares will generate enough dividend income every year to buy an additional share.
This is dividend snowballing - where dividends buy more shares, which generate more dividends, which buy even more shares.
What Dividend Yield Doesn't Tell You
While dividend yield is useful, it has limitations:
It doesn't show you:
- Whether the dividend is sustainable.
- The company's financial health.
- Future growth potential.
- Tax implications (dividends are taxable income).
- Whether the company might cut the dividend.
Dividend yield is one way investors analyze a stock.
Always analyze the full picture, which includes the company's balance sheet, cash flow, payout ratio, and business fundamentals - not just the yield.
And before dividend yield traps - this is when investors hold on to a dividend stock for the payout, despite the stock’s price falling.
Think of it this way: If you buy a stock for $100 that pays a $5 annual dividend (5% yield), you're happy.
But if the stock drops to $50, that $5 dividend is now a 10% yield - which looks great.
However, you've also lost $50 in stock value, which more than wipes out any dividend gains.
Final Thoughts On Dividend Yield
Calculating dividend yield is simple: Take the annual dividend per share, divide by the current stock price, and multiply by 100.
But understanding what that number means - and using it strategically - is where the real wealth-building happens.
Income investors use this formula to decide which stock is the best cash flow opportunity for them.
In the end, investors must consider more than just a company's yield when evaluating a stock. Dividend yield is just another analysis tool, but not the only one.
Remember that companies do not have to pay a dividend and can stop paying one at any time.
Still - investors may have the opportunity to turn a simple formula into a real income stream with the right combination of math, research, and analysis.
Our market analysts are researching new potential investment opportunities every week in Market Briefs Pro.
What’s that? Our investment report gives you all of the data you need to make smarter investment decisions - that way you get an edge on Wall Street.